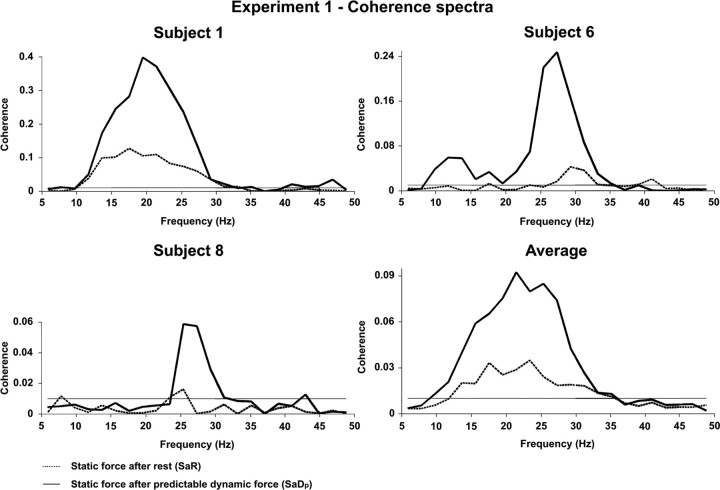
Figure 2.
EEG-EMG coherence spectra of three representative subjects and combined across all eight subjects of experiment 1. Corticospinal coherence is compared during SaR (dotted line) and SaDp (solid line). The horizontal line in each coherence spectrum designates 95% confidence level. Note that beta-range coherence is excessively enhanced during SaDp compared with SaR.

