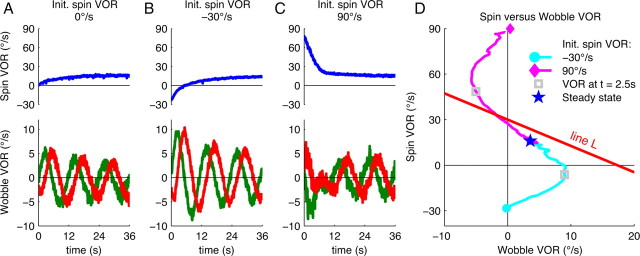
Figure 3.
Transient responses to spin pulse-injections before OVAR onset. A, Spin and wobble VOR during the first three cycles of OVAR initiated without any spin signal. B, C, Spin and wobble VOR during OVAR after injection of a negative (B) or positive (C) spin. D, Spin as a function of wobble showing an S-shaped behavior after an initial spin VOR of −30°/s (blue circle and trace) or after an initial spin VOR of 90°/s (diamond and magenta trace). Gray square, VOR at t = 2.5 s. Blue star, Average steady-state VOR. For comparison, also line L is plotted (as in Fig. 2C). The traces in A–D are averages across all trials.

