
Figure 2.
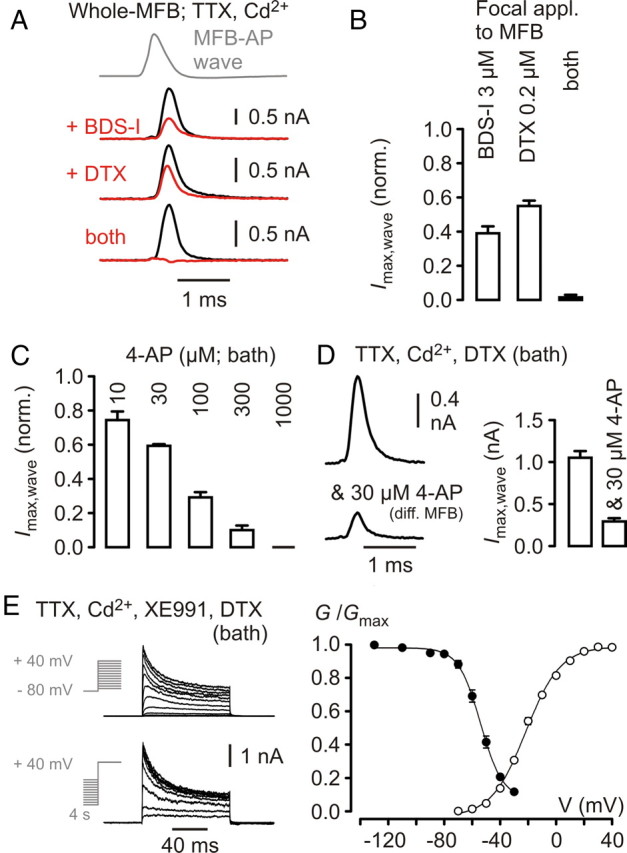
Kv3 channel-mediated currents dominate during the MFB–AP waveform. A, Top, MFB–AP voltage waveform applied to MFBs. Second to last line of traces, K+ currents before (black) and during (red) application of drugs as indicated. Concentrations used as in Figure 1C. B, Collected data for the AP-wave-evoked K+ current peak amplitude during drug application normalized to baseline (each n = 4). C, Collected data for the AP-wave-evoked K+ current peak amplitude during bath application of 4-AP at concentrations as indicated above the bars, normalized to baseline (n = 3–12). D, Left, Top, Representative average trace of AP-wave-evoked K+ currents in the presence of DTX (bath; 0.2 μm); left, bottom, different MFB recording in the presence of DTX and 30 μm 4-AP (bath). Right, Summary of peak current amplitudes in the two conditions (different sets of experiments; n = 16 and 9). E, Left, K+ currents in DTX (bath; 0.2 μm) in response to the voltage step protocols indicated. Right, Relative K+ conductance as function of test potential (open circles; n = 9) and of conditioning prepulse potential (filled circles; n = 5) in DTX.