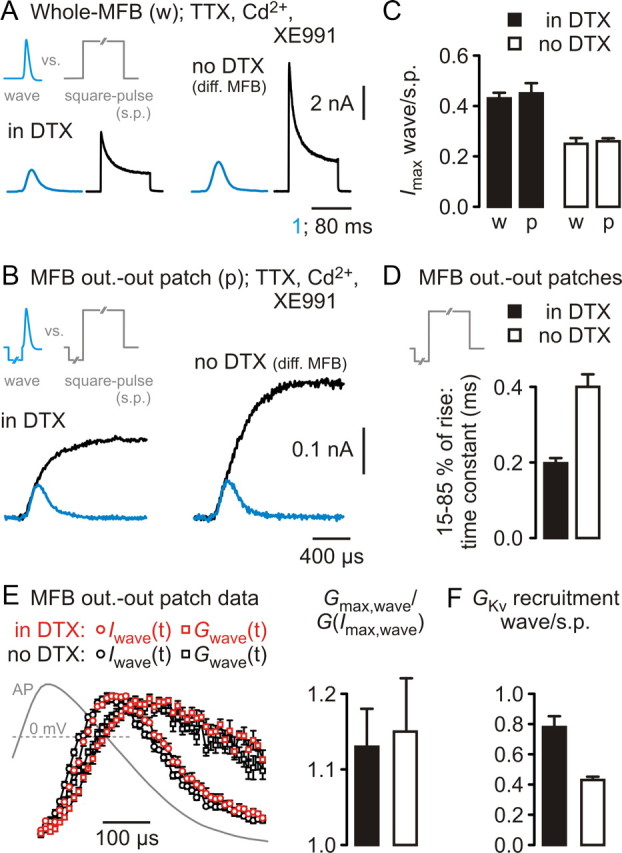
Figure 3.

Kv3 are better recruited during MFB–AP waves than Kv1. A, Top, MFB–AP-wave command and square-pulse command applied in the whole-MFB configuration (w). Bottom, Left, K+ current traces from recordings in DTX; right, K+ current traces from recordings without DTX. Responses to the MFB–AP wave on the respective left side of the two drug conditions (blue traces). The 1 ms timescale applies to MFB–AP wave experiments and 80 ms timescale to square-pulse experiments. B, Top, MFB–AP-wave command and square-pulse command applied to outside-out patches (p) from MFBs. Bottom, Left, K+ current traces from recordings in DTX; right, K+ current traces from recordings without DTX. Responses to the MFB–AP wave (blue traces) were overlaid on the responses to the square pulse and aligned to the rising phase. C, Collected data from experiments as in A and B, displaying the ratio of peak current amplitudes obtained in response to the MFB–AP wave and to the square pulse (p, outside-out patch; w, whole-MFB). D, Time constants of a simple exponential function fitted to the rising phase (15–85% of peak amplitude) of current responses to the square pulse as in B from five (in DTX) and four (without DTX) experiments. E, Left, Time course of MFB–AP-wave-evoked K+ currents [Iwave(t), circles] and derived K+ conductances [Gwave(t), squares] from experiments in DTX (red symbols; n = 5) and without DTX (black symbols; n = 8), using the outside-out patch configuration. AP superimposed. Right, Ratio of the maximal K+ conductance during the MFB–AP (Gmax,wave) and the conductance at the peak of the K+ current [G(Imax,wave)] during the MFB–AP. Filled bar, Experiments in DTX; open bar, experiments without DTX. F, Fractions of conductances at resting membrane potential that become activated during an MFB–AP. s.p., Square pulse; filled bar, experiments in DTX; open bar, experiments without DTX.
