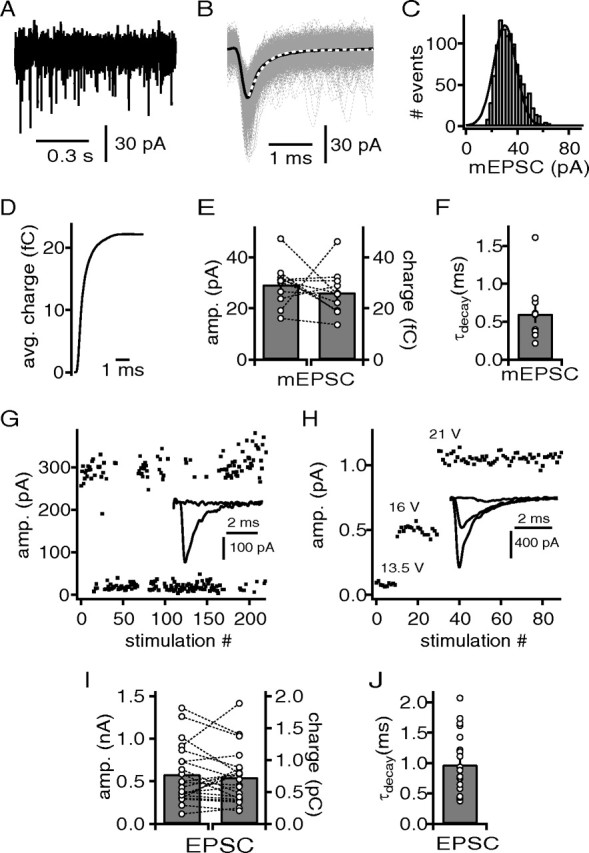
Figure 4.

Quantal content of excitatory input fibers to DNLL neurons. A, Example recording of mEPSCs. B, Extracted and aligned mEPSCs from the recording of the cell shown in A. Average mEPSC (black line) was used to determine the decay time constant with an exponential fit (white dotted line), and the 20–80% rise time. C, Frequency histogram of the peak amplitudes of mEPSCs from the recordings in A. A Gaussian fit (black line) was used to determine the median and the coefficient of variation of the mEPSC distribution. D, Integrated average mEPSC from B. E, mEPSC amplitude derived from the Gaussian fits and the corresponding charge of the average mEPSC. F, The decay time of the average mEPSCs. G, Minimal stimulation paradigm with a stimulation strength close to threshold inducing EPSC events and failures. The inset shows overlaid failure and EPSC event response. H, Minimal stimulation paradigm with increasing stimulation strength to obtain step-like EPSC responses. The inset shows EPSCs at different stimulation intensities. I, Peak amplitude and the corresponding charge of the average minimal evoked EPSCs. J, The decay time of the average minimal evoked EPSCs.
