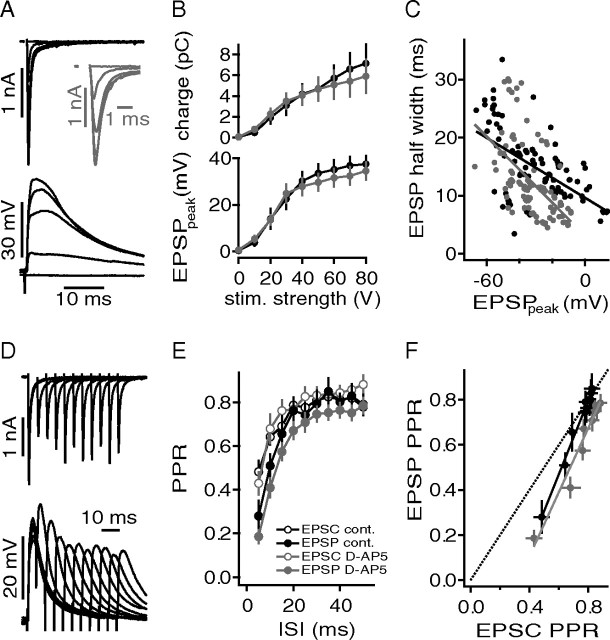
Figure 7.
NMDAR currents promote spatial and temporal EPSP summation. A, Synaptically evoked EPSCs recorded at −60 mV (top) and synaptically evoked voltage responses from the same neuron in current clamp (bottom). For both recording modes, the stimulus intensity was varied between 80 and 0 V and applied to the same stimulation site. The inset shows a magnified view of the EPSCs (gray). B, EPSC charge (top) and EPSP delta voltage deflection (bottom) as a function of stimulation strength. The black symbols represent control data (n = 15), and the gray symbols correspond to the population data obtained with bath-applied d-AP5 (n = 15). The color code is the same throughout. C, EPSP half-width as a function of the absolute EPSP peak amplitude. D, Synaptically evoked paired-pulse responses with varying ISIs. The top panel shows EPSCs recorded at −60 mV, and the bottom shows EPSPs from the same neuron, stimulation site, and stimulus intensity. E, PPR as a function of ISI of EPSCs and EPSPs under control conditions (n = 16) and during the bath application of d-AP5 (n = 11). F, PPR of EPSPs plotted against the PPR of EPSCs. Each obtained at different ISIs as shown in E. Unity is indicated by a dashed black line; solid lines represent regression fits to the control (black) and d-AP5-treated cell groups. In all experiments shown, AP generation was blocked by internal application of QX314.

