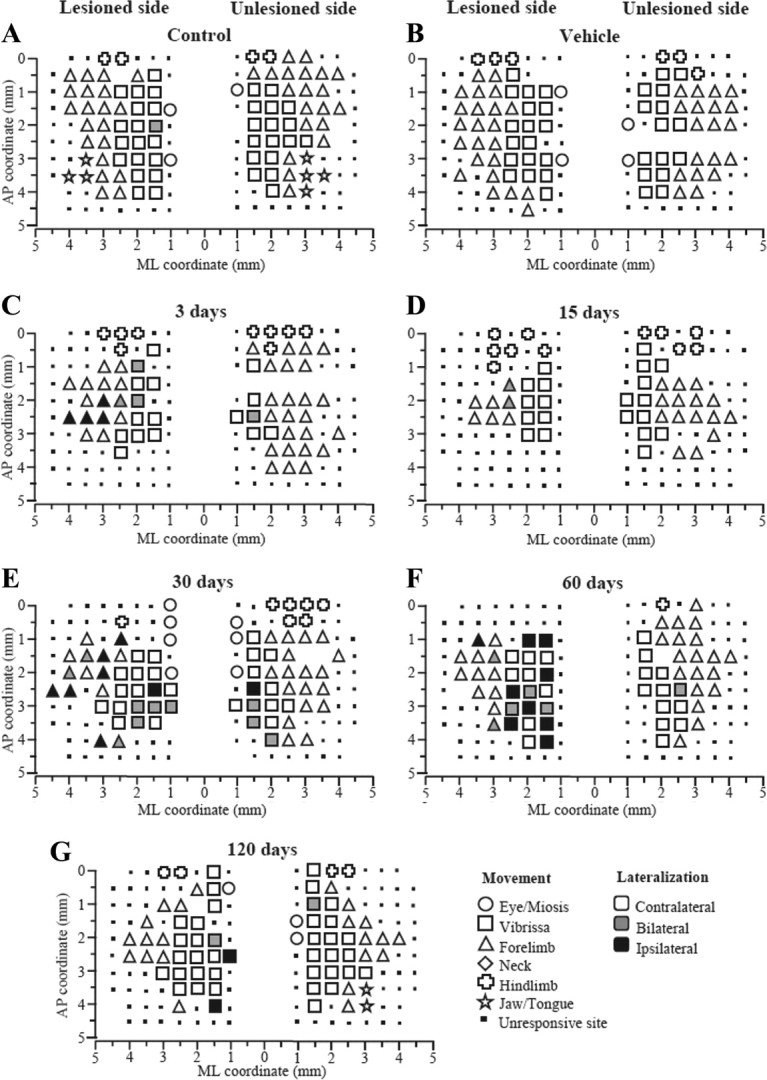
Figure 2.

Unilateral 6-OHDA injection in rats affected M1 output. Representative bilateral M1 maps of movements evoked at threshold current levels in control (A), sham (B), and 6-OHDA rats at 3 (C), 15 (D), 30 (E), 60 (F), and 120 (G) days after lesion. The microelectrode was sequentially introduced to a depth of 1500 μm. Interpenetration distances were 500 μm. In these mapping schemes, frontal poles are at the bottom. Zero (0) corresponds to bregma and numbers indicate rostral distance from the bregma or lateral distance from the midline. Movement evoked at one point is indicated by symbols and movement lateralization by different gray scale. Absence of symbol (within or at the border of the maps) indicates that penetration was not performed due to the presence of a large vessel.
