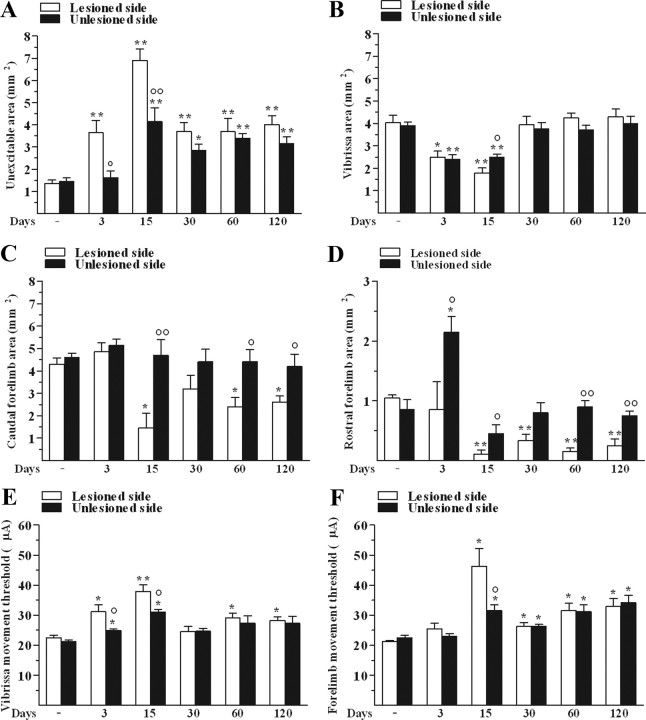
Figure 3.
Unilateral 6-OHDA injection in rats changed M1 excitability. 6-OHDA affected the size (in mm2) of unexcitable (A), vibrissa (B), caudal (C), and rostral forelimb (D) areas as well as threshold currents (in μA) in vibrissa (E) and forelimb (F) areas in both the lesioned side and unlesioned side. All measures were performed in control and 6-OHDA rats at 3, 15, 30, 60, and 120 d after lesion. Data are means ± SEM of five determinations per group. Statistical results: A, Effect of treatment (F(1,4) = 294.36, p < 0.0001), time (F(5,40) = 19.60, p < 0.0001), and time × treatment interaction (F(5,40) = 3.12, p = 0.0180). B, Effect of treatment (F(1,4) = 2.07, p = 0.22), time (F(5,40) = 20.30, p < 0.0001), but not time × treatment interaction (F(5,40) = 1.17, p = 0.34). C, Effect of treatment (F(1,4) = 45.12, p = 0.0026), time (F(5,40) = 4.71, p = 0.0018), and time × treatment interaction (F(5,40) = 2.74, p = 0.03). D, Effect of treatment (F(1,4) = 51.48, p = 0.0020), time (F(5,40) = 11.34, p < 0.0001), and time × treatment interaction (F(5,40) = 3.58, p = 0.0091). E, Effect of treatment (F(1,4) = 50.07, p = 0.0021), time (F(5,40) = 11.47, p < 0.0001), and time × treatment interaction (F(5,40) = 1.41, p < 0.24). F, Effect of time (F(5,40) = 16.67, p < 0.0001) but not treatment (F(1,4) = 1.91, p = 0.24), and significant time × treatment interaction (F(5,40) = 3.82, p = 0.0063). *p < 0.05, **p < 0.01 different from control; °p < 0.05, °°p < 0.01 different from the lesioned side (RM ANOVA followed by contrast analysis and the sequentially rejective Bonferroni's test for multiple comparisons).

