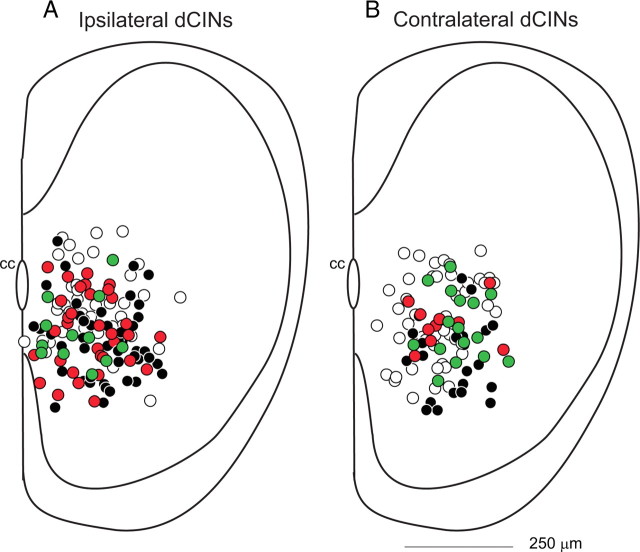
Figure 10.
Spatial distribution of responsive and nonresponsive L2 dCINs. A, B, The position of individual ipsilateral (A) and contralateral (B) dCINs recorded was plotted on a representative section of the obliquely cut L2 segment. The dCINs were color-coded according to their responsiveness to MRF stimulation; the dCINs that responded to stimulation of the medial (28 of 224) and lateral (43 of 224) MRF only are shown as green and red circles, respectively, and the dCINs that responded to both medial and lateral MRF (67 of 224) and those that were nonresponsive (86 of 224) are shown as black and white circles, respectively. cc, Central canal. Scale bar: A and B, 250 μm.

