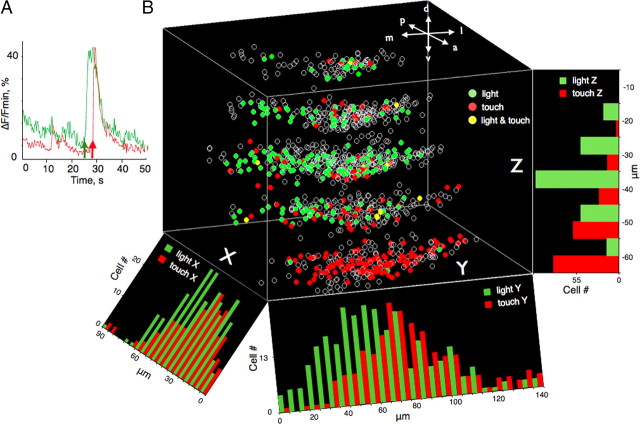
Figure 2.
A, Change in fluorescence averaged across 25 light- and touch-evoked cerebellar neurons (green and red lines, respectively) as a function of time. The green arrow represents the onset of the visual stimulus (CS). The red arrow depicts the timing of touch delivery. B, Three-dimensional functional map of the left cerebellar hemisphere. The zero point on the z-axis is located at the dorsal surface of the cerebellum. Each z-section is separated by 10 μm. The intersection between x- and y-axes is the point where the midline between the hemispheres crosses the border to the optic tectum. Each circle depicts the position of an individual neuron. Green circles represent the light-driven neurons. Red circles represent touch-evoked neurons. Yellow circles represent neurons that responded to both visual and tactile stimuli. Orientation is as indicated: a, anterior; p, posterior; m, medial; l, lateral; d, dorsal, v, ventral. Histograms depict the density of light- and touch-evoked neurons (green and red bars, respectively) projected on x-, y-, and z-axes. Note that the density of touch-driven cells gradually increases in the dorsolateral direction, whereas light-evoked neurons are most densely packed at a depth of 40 μm.

