
Figure 2.
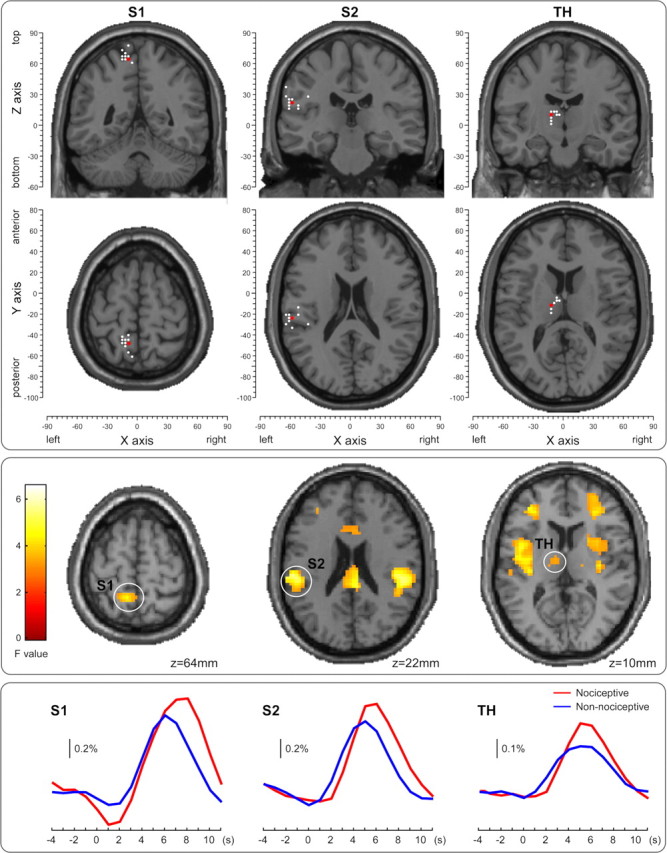
The ROIs used in the DCM analysis: contralateral S1 (left column), contralateral S2 (middle column), and contralateral thalamus (TH) (right column). The locations of the maximally activated voxels across the group (red dots, top panel) were selected from the contralateral (left) hemisphere based on the conjunction map of the responses elicited by nociceptive and non-nociceptive stimuli, thresholded at p < 0.001 and cluster size of >10 voxels (middle panel). The ROIs of each participant were formed by the voxels contained within a sphere of 5 mm radius, centered at the maximally activated voxel (white dots, top panel) nearest to the corresponding group maxima, based on the individual conjunction map thresholded at p < 0.05 and cluster size of >10 voxels. The locations of the group maxima (red dots) and individual maxima (white dots) are superimposed on axial and coronal structural MRIs from the MNI template (top panel), selected from the location of the group maxima. Coordinates of both individual and group maxima of activation are reported in Table 1. The bottom panel shows the BOLD time courses of the responses elicited by both nociceptive and non-nociceptive stimuli in each ROI.