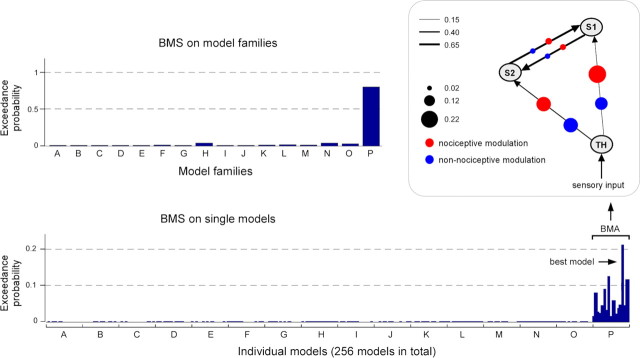
Figure 3.
The results of the Bayesian model selection (BMS). Top left panel, The exceedance probabilities of all 16 model families (A–P) showed that the model family P (in which both connections from the thalamus to S1 and to S2 are modulated in both nociceptive and non-nociceptive processing) exceeds by far those of all the other model families. Bottom panel, The exceedance probabilities of all single models (sorted according to model family) showed that the models in family P had always higher exceedance probabilities and that, within family P, one model seemed to outperform the other models (i.e., it was the best model). Top right panel, Structure of the average model of the winning family P. The black lines with arrows represent the intrinsic connections between brain areas and the thickness of each line indicates the mean strength of each intrinsic connection across participants. The size of the red and blue dots on each connection represents the magnitude of the modulatory effect of nociceptive or non-nociceptive stimulation, respectively. This structure shows that the two forward connections from the thalamus to S1 and to S2 were strongly modulated by both nociceptive and non-nociceptive somatosensory inputs, whereas the two reciprocal connections between S1 and S2 were only weakly modulated by both types of inputs.

