
Figure 5.
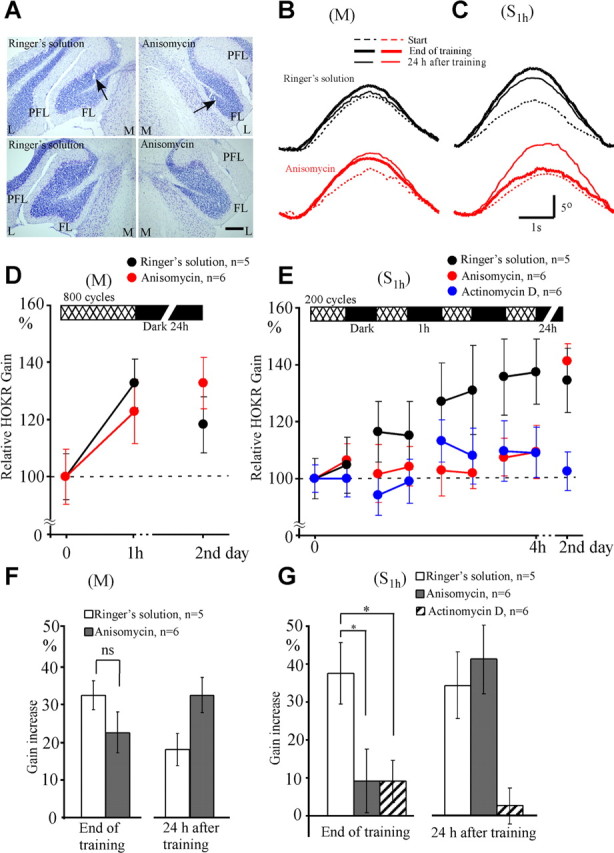
Effects of protein synthesis inhibition on adaptation induced by massed (M) and spaced (S1 h) training. Anisomycin or control Ringer's solution was infused 4 h before the initiation of M training and 1 h before the initiation of S1 h training. A, Photographs of Nissl-stained flocculus. The left two photographs show examples 24 h after infusions of Ringer's solution, and the right two photographs show examples 24 h after anisomycin infusions. Arrows show positions of the tip of infusion needle. The distance between the upper and lower photographs is 80 μm. Note that tissue damage by infusion was minimal, and the general cortical structure was not affected by infusions. FL, Flocculus; L, lateral; M, medial; PFL, paraflocculus. Scale bar, 200 μm. B, Averaged eye position traces obtained from the same mouse in M training. Black dotted, thick, and thin curves show eye position traces at the start, end, and after 24 h of training, respectively, after infusion of Ringer's solution. Red curves similarly show eye position traces after anisomycin infusion. C, Similar to B but for the data obtained during S1 h training. Eye position traces for 10–21 cycles were averaged in B and C. Scale bars, 1 s and 5°. D, E, Time course of HOKR adaptation and its retention after infusions of Ringer's solution (black circles), anisomycin (red circles), and actinomycin D (blue circles). F, Comparison of gain increase at the end and 24 h after the end of M training. Unfilled and filled columns indicate data for Ringer's solution (n = 5) and anisomycin (n = 6) infusions, respectively. G, Similar to F, but for the gain increase after S1 h training. Data obtained after actinomycin D infusions (n = 6) were also shown by striped columns. *p < 0.05; ns, p > 0.05 (Dunnett's test or Student's t test). Error bars indicate SE.