
Figure 5.
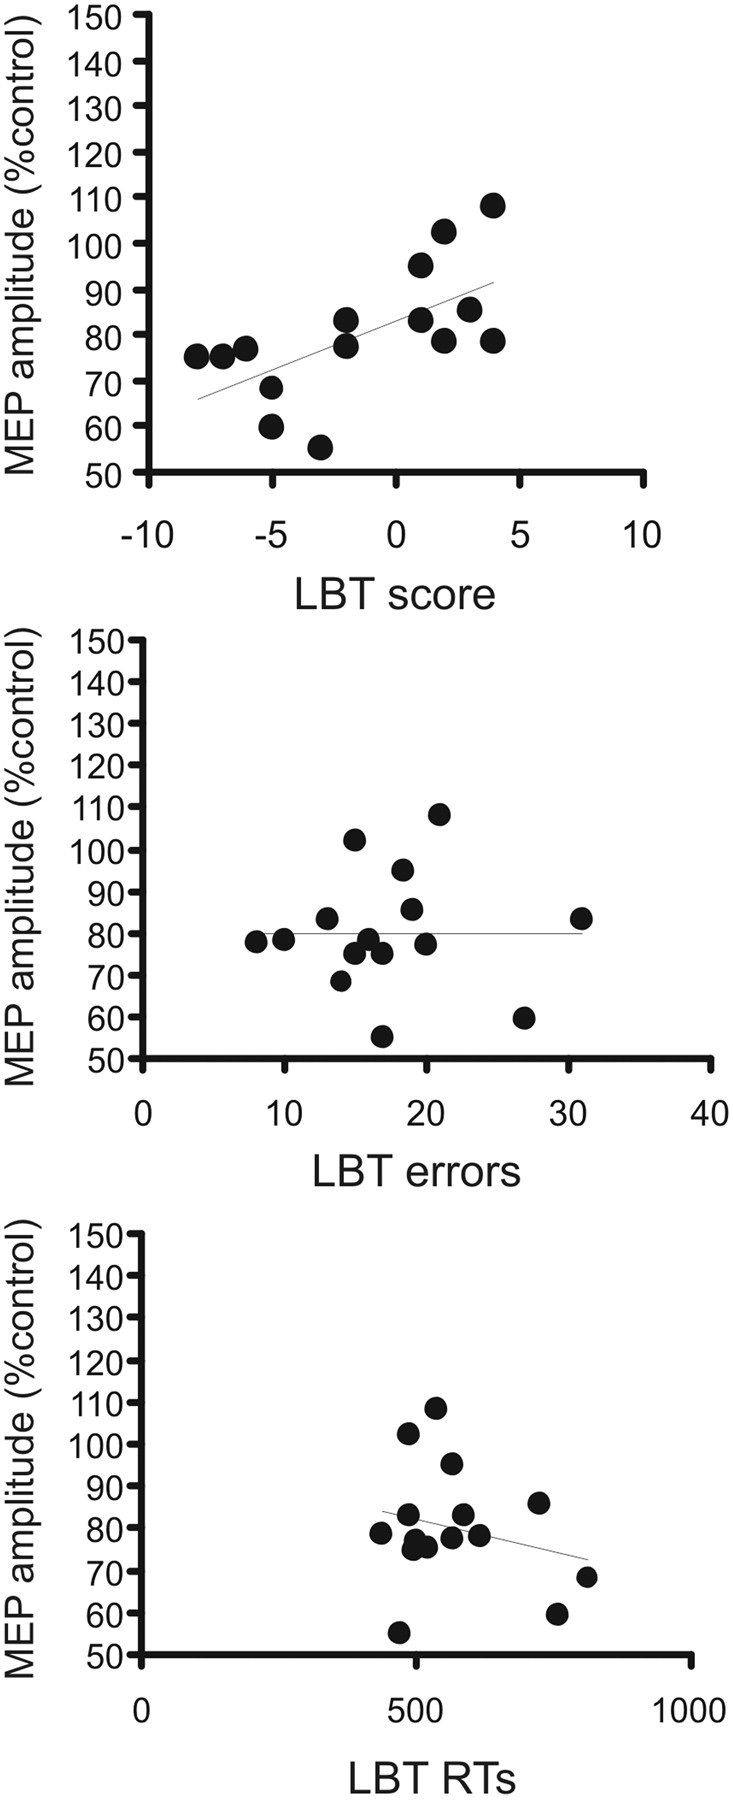
Correlation between individual mean values of pIHI and behavioral outcomes. Top, Mean pIHI versus total score obtained in the line bisection task (LBT). Middle, Mean pIHI versus total number of errors. Bottom, Mean pIHI versus reaction times. *p < 0.05.