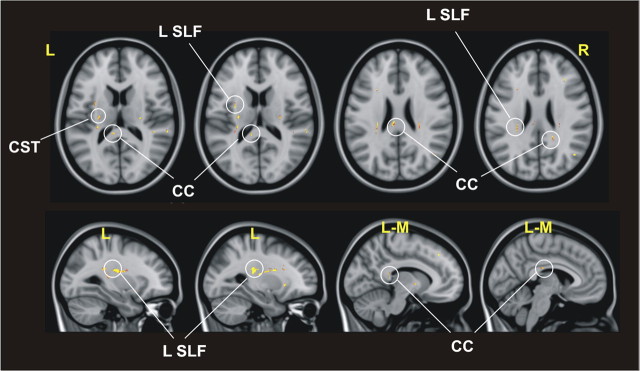
Figure 6.
Areas of significant association between the individual amount of interhemispheric inhibition induced by right PPC stimulation on the PPC–M1 connection in the left hemisphere and the local individual estimates of FA. The areas of significant association are shown with a red/yellow color scale, where brighter colors indicate a more significant association. CST, Corticospinal tract; L, left; R, right; L-M, left-medial.

