Figure 2.
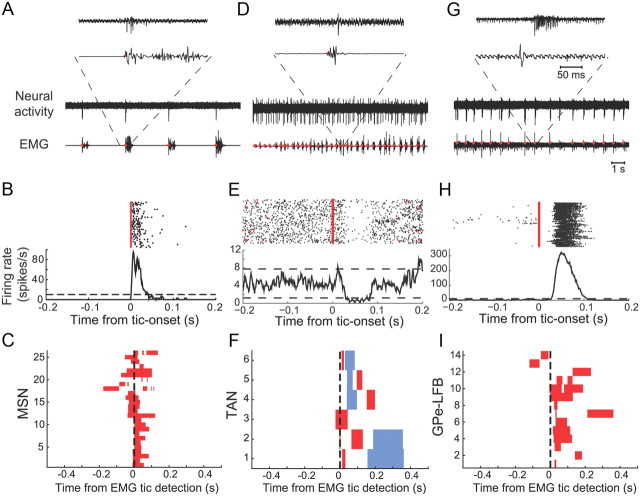
Peri-tic neuronal activity. A, D, G, Representative examples of raw traces and peri-tic neuronal activity of a PAN (A), TAN (D), and GPe LFB (G). Traces of recorded activity are shown together with the simultaneously recorded EMG activity (zygomaticus major muscle) in two time scales: 14 s (bottom traces) and insets of 300 ms (top traces). B, E, H, Neuronal activities aligned to tic-onset time of the same PAN (B), TAN (E), and LFB (H) are presented as peri-tic rasters (top; red triangles, tic-onset time as detected from the EMG activation; black dots, neuronal action potentials) and peri-tic time histograms (bottom). Dashed lines in the histograms are the upper and lower 99% confidence limits. C, F, I, Population peri-tic histogram matrices of all responding PAN (C), TAN (F), and LFB (I) neurons. Only periods of significant (p < 0.01) changes in firing rate are presented for each neuron (red, rate increase; blue, rate decrease).

