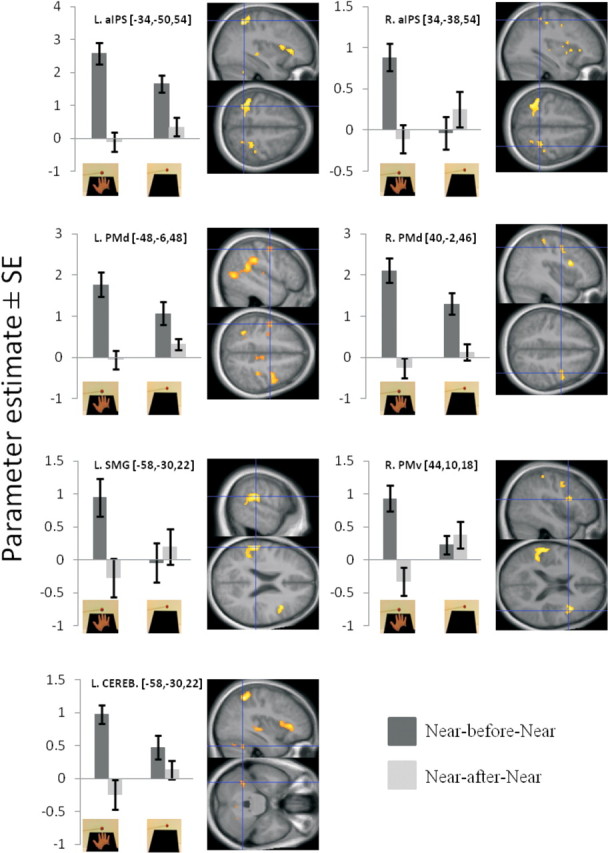
Figure 3.

Key areas showing significant BOLD adaptation to near-hand stimuli, only when the hand is placed on the table (first analysis approach; p < 0.05 corrected). Activation maps correspond to the direct comparison of the near adaptation effects in the runs when the hand is present on the table and the runs when the hand is retracted [(Near-before-Near vs Near-after-Near)HAND vs (Near-before-Near vs Near-after-Near)NO HAND]. The plots on the left correspond to the parameter estimates for the Near-before-Near and Near-after-Near conditions, from the HAND (left) runs and the NO HAND (right) runs (as indicated by the pictures), respectively. Error bars represent SEM. The three numbers next to the titles refer to the x, y, and z coordinates in MNI space. Each plot is presented next to the corresponding activation map overlaid onto a sagittal and an axial slice of the mean high-resolution structural scan of all participants. The significant peaks of activation (p < 0.05 corrected) can be identified by the blue crosshairs. The threshold of the activation maps was set at p < 0.001 uncorrected for display purposes. CEREB, Cerebellum.
