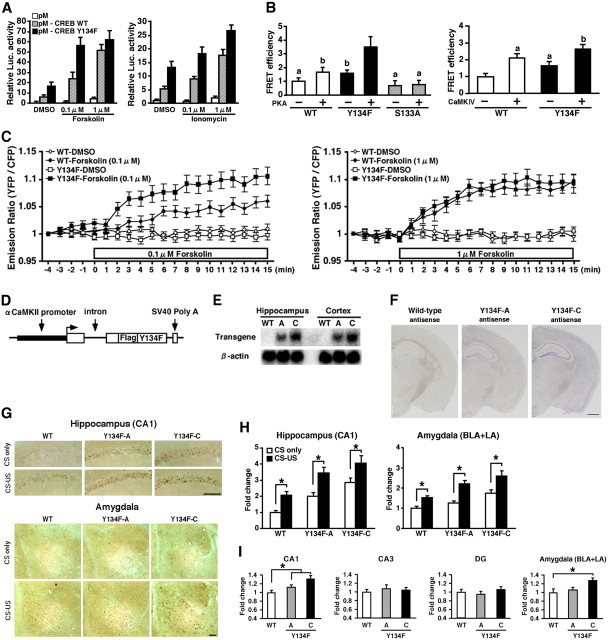
Figure 1.
Generation of CREB-Y134F expression mice. A, Activation of CREB-mediated transcription by the upstream signal transduction pathway in PC12 cells. B, CREB–CBP (KIX) complex formation in COS-1 cells in the acceptor bleaching test. We analyzed 34–54 cells in each group. ap < 0.05, compared with the other groups; bp < 0.05, compared with the other groups. C, Real-time imaging of CREB–CBP (KIX) complex formation in response to the activation of the PKA signaling pathway in PC12 cells. Emission ratios were measured before and after the application of FSK (0.1 or 1 μm). We analyzed 32–39 cells in each group. In the presence of 0.1 μm FSK, repeated ANOVA revealed significant effects of time, mutation (WT vs Y134F) and time versus mutation interaction (time, F(19,1254) = 29.050, p < 0.05; mutation, F(1,66) = 7.920, p < 0.05; interaction, F(19,1254) = 2.721, p < 0.05). In contrast, in the presence of 1 μm FSK, repeated ANOVA revealed a significant effect of time, but not effects of mutation and time vs mutation interaction (time, F(19,1406) = 52.206, p < 0.05; mutation, F(1,74) = 0.283, p > 0.05; interaction, F(19,1406) = 0.503, p > 0.05). D, Schematic representation of the CREB-Y134F transgenic construct. E, Northern blot analysis of the transgene in the hippocampus and cortex of WT, Y134F-A (A), and Y134F-C (C) mice. The SV40 poly(A) probe detected transgenic mRNA of 2.5 kb. F, In situ hybridization analyses of transgene mRNA expression in Y134F-A, Y134F-C, and WT mice. The SV40 poly(A) probe detected transgene mRNA in the forebrain of Y134F-A and Y134F-C mice. Scale bar, 500 μm. G, Immunohistochemical analyses of c-fos expression after fear conditioning. Scale bar, 100 μm. H, Quantification of the number of c-fos-positive cells after contextual fear conditioning in WT, Y134F-A, and Y134F-C mice. The conditioning group consisted of WT (n = 8), A (n = 8), and C (n = 8); the no-conditioning group consisted of WT (n = 8), A (n = 9), and C (n = 10). I, Quantification of the number of c-fos-positive cells at the basal condition. One-way ANOVA followed by the post hoc Newman–Keuls test showed significantly higher expression levels of c-fos in the CA1 (p < 0.05) but not the CA3 or dentate gyrus (DG) areas of the hippocampus in Y134F-A and -C mice compared with WT mice. Similarly, Y134F-C mice showed significantly higher expression levels of c-fos in the amygdala compared with WT mice (p < 0.05). Y134F-C mice displayed higher expression levels of c-fos in the hippocampal CA1 and amygdala compared with Y134F-A mice, although this difference was not significant. WT mice, n = 11; Y134F-A mice, n = 11; Y134F-C mice, n = 10. Error bars represent SEM. *p < 0.05. BLA, Basolateral amygdala; LA, lateral amygdala.

