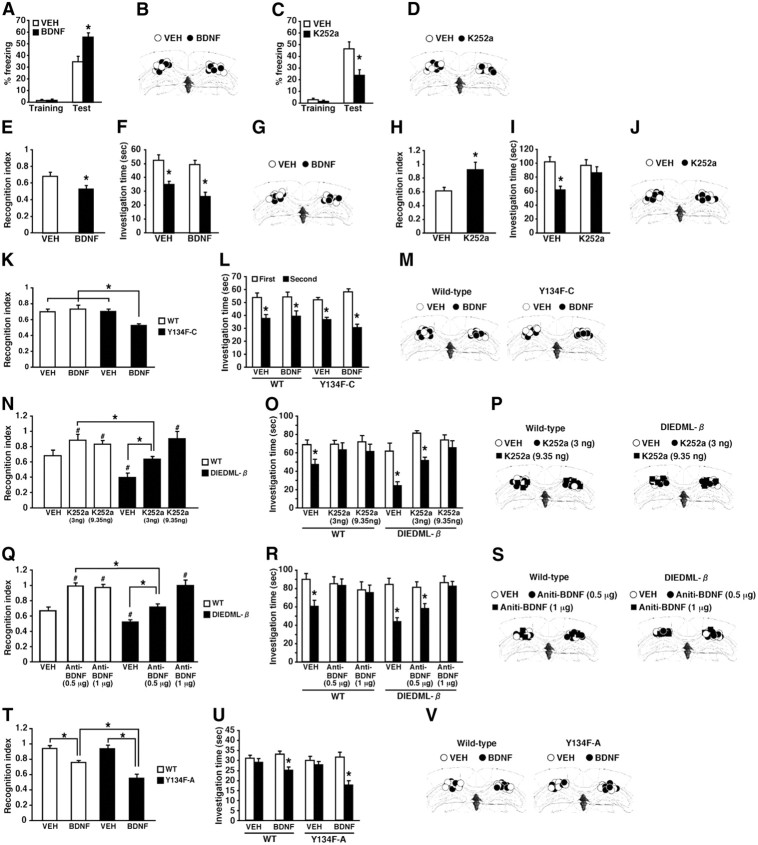
Figure 8.
Effects of the microinfusion of BDNF and K252a on STM and LTM in active CREB and WT mice. A, Effects of the microinfusion of BDNF into the dorsal hippocampus on 2 h short-term contextual fear memory in WT mice (VEH, n = 14; BDNF, n = 11). *p < 0.05, compared with the VEH group at test. B, D, G, J, M, P, S, V, Cannula tip placements from mice infused with each drug for A, C, E, H, K, N, Q, and T, respectively. Coronal sections are adapted from Paxinos and Franklin (1997) (1.94 mm posterior to bregma). C, Effects of the microinfusion of K252a into the dorsal hippocampus on 2 h short-term contextual fear memory in WT mice (VEH, n = 9; K252a, n = 8.). *p < 0.05, compared with the VEH group at test. E–G, Effects of the microinfusion of BDNF into the dorsal hippocampus on the 2 h short-term social recognition memory in WT mice (VEH, n = 8; BDNF, n = 8). E, Recognition index. *p < 0.05, compared with the VEH group. F, Investigation time. The VEH or BDNF group showed significant reductions in investigation time (p < 0.05), indicating that both groups formed 2 h STM. *p < 0.05, compared with the first exposure (left). H–J, Effects of the microinfusion of K252a into the dorsal hippocampus on the 2 h short-term social recognition memory in WT mice (VEH, n = 8; K252a, n = 8). H, Recognition index. *p < 0.05, compared with the VEH group. I, Investigation time. The VEH, but not K252a, group showed a significant reduction in investigation time (VEH, F(1,14) = 17.82, p < 0.05; K252a, F(1,14) = 0.727, p > 0.05), indicating that only the VEH group formed 2 h STM. *p < 0.05, compared with the first exposure. K–M, Effects of the microinfusion of a low dose of BDNF into the dorsal hippocampus on 30 min STM in WT and Y134F-C mice (WT-VEH, n = 8; WT-BDNF, n = 9; C-VEH, n = 9; C-BDNF, n = 8). K, Recognition index. *p < 0.05, compared with the other three groups. L, Investigation time. WT and Y134F-C mice treated with BDNF or VEH showed a significant reduction in investigation time (p < 0.05), indicated that all groups formed STM. *p < 0.05, compared with the first exposure. N–P, Effects of the microinfusion of low or high doses of K252a (3 or 9.35 ng per side) into the dorsal hippocampus on 2 h STM in WT and DIEDML-β mice (WT-VEH, n = 10; WT-low, n = 8; WT-high, n = 8; β-VEH, n = 8; β-low, n = 9; β-high, n = 10). N, Recognition index. #p < 0.05, compared with WT-VEH; *p < 0.05, compared with WT-low K252a. O, Investigation time. The WT-VEH, β-VEH, and β-low groups showed significant reductions in investigation time (p < 0.05), whereas the other groups did not (p > 0.05). These observations indicated that the WT-VEH, β-VEH, and β-low groups formed 2 h STM. *p < 0.05, compared with the first exposure. Q–S, Effects of the microinfusion of a low or high dose of anti-BDNF antibody (0.5 μg or 1 μg per side) into the dorsal hippocampus. A higher dose of anti-BDNF antibody is required to impair 2 h STM in DIEDML-β mice compared with WT mice (WT-VEH, n = 9; WT-low, n = 9; WT-high, n = 8; β-VEH, n = 11; β-low, n = 10; β-high, n = 10). Q, Recognition index. A significant interaction between genotype × drug treatment (low vs high dose of anti-BDNF antibody) was observed (F(1,33) = 8.594, p < 0.05). The β-VEH group exhibited enhanced 2 h STM compared with the WT-VEH group (p < 0.05). WT-low and -high groups displayed significantly worse recognition indices compared with the WT-VEH group (p < 0.05). The β-low group displayed a comparable recognition index (p > 0.05), but the β-high group displayed a significantly worse recognition index, compared with the WT-VEH group, respectively. #p < 0.05, compared with WT-VEH; *p < 0.05, compared with WT-low BDNF antibody. R, Investigation times. The WT-VEH, β-VEH, and β-low groups showed a significant reduction in investigation time (p < 0.05), whereas the other groups did not (p > 0.05). These observations indicated that the WT-VEH, β-VEH, and β-low groups formed 2 h STM. *p < 0.05, compared with the first exposure. T–V, Effects of the microinfusion of BDNF into the dorsal hippocampus on 48 h LTM in Y134F-A and WT mice (WT-VEH, n = 9; WT-BDNF, n = 10; A-VEH, n = 9; A-BDNF, n = 11). T, Recognition index. *p < 0.05, compared with the other three groups. U, Investigation time. The WT-BDNF and A-BDNF groups (p < 0.05), but not the WT-VEH and A-VEH groups (p > 0.05), showed significant reductions in investigation time, indicating that the WT-BDNF and A-BDNF groups formed LTM, whereas the other groups did not. *p < 0.05, compared with the first exposure. Error bars represent SEM.

