Figure 5.
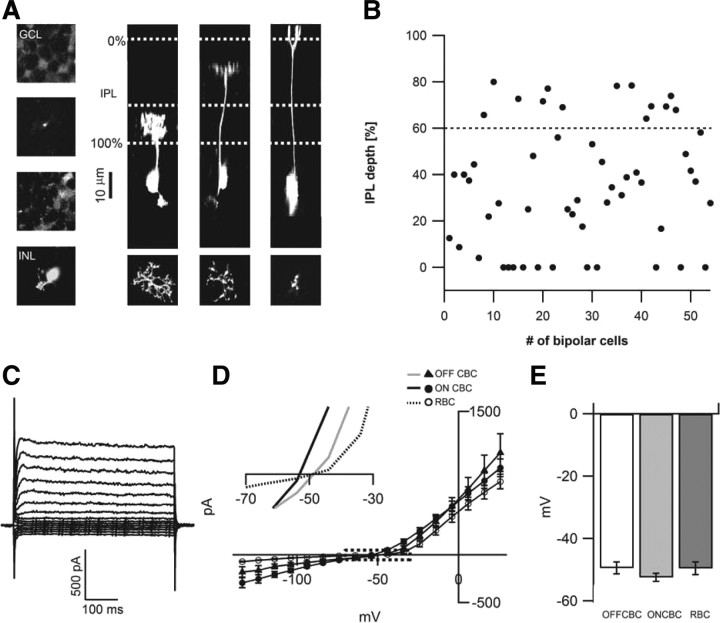
ON and OFF rd1 bipolar cells appear morphologically intact and have negative resting potentials. A, Two-photon image stacks through different layers of the rd1 retina after electrophysiological recording from bipolar cells reveals Alexa Fluor 594 labeling of (left, top to bottom) the GCL, the bipolar cell axon, the amacrine cell layer, and the bipolar cell soma. The thickness of the IPL was defined by regions between the GCL (0%) and the amacrine cell layer (100%) as indicated by the horizontal white dotted lines (right). The 60% level that separates the ON and OFF layers is also indicated. In the right three panels, image stacks of bipolar cells filled with Alexa Fluor 594 were rotated 90° to reveal their axonal arborizations in different layers of the IPL. Top views of their terminals are illustrated in the bottom. B, The depth of peak fluorescence of the axon terminal for rd1 bipolar cells in this study are plotted (n = 54). C, Examples of the currents elicited by voltage steps (−100 to +40 mV) from a holding potential of −60 mV in rd1 ON bipolar cell. D, The averaged currents measured at steady state (between 45 and 50 ms after the onset of the voltage step) in rd1 OFF, ON, and rod bipolar cells. The boxed region is shown at a higher magnification to illustrate the average voltages where currents reverse (inset). E, Plot of the average resting potentials in rd1 bipolar cells.

