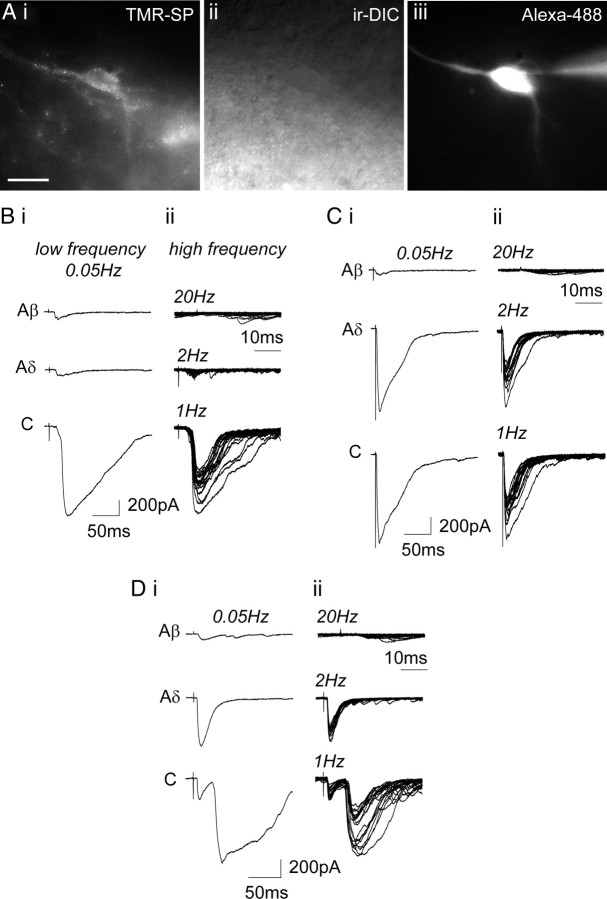
Figure 3.
Primary afferent synaptic input to lamina I NK1R+ neurons. A, TMR-SP labeling of a control lamina I neuron. The neuron is visualized with TMR-SP fluorescence (i), IR-DIC (ii), and filled with Alexa Fluor 488 hydrazide (iii). Recording pipette can be seen in iii. Scale bar, 20 μm. B, Characterization of primary afferent synaptic input to a control lamina I NK1R+ neuron receiving monosynaptic C-fiber input. C and D show characterization of primary afferent synaptic input to CFA lamina I NK1R+ neurons receiving monosynaptic Aδ-fiber and monosynaptic Aδ-fiber and monosynaptic C-fiber input, respectively. In B–D, i shows examples of EPSCs evoked by stimulation (0.1 ms) using Aβ-fiber (25 μA), Aδ-fiber (100 μA), and C-fiber (500 μA) stimulation intensities at low frequency. Each trace comprises three averaged traces evoked at 0.05 Hz. ii shows examples of EPSCs evoked by higher-frequency stimulation (25 μA/20 Hz; 100 μA/2 Hz; 500 μA/1 Hz). Each trace comprises 20 superimposed traces.

