
Figure 1.
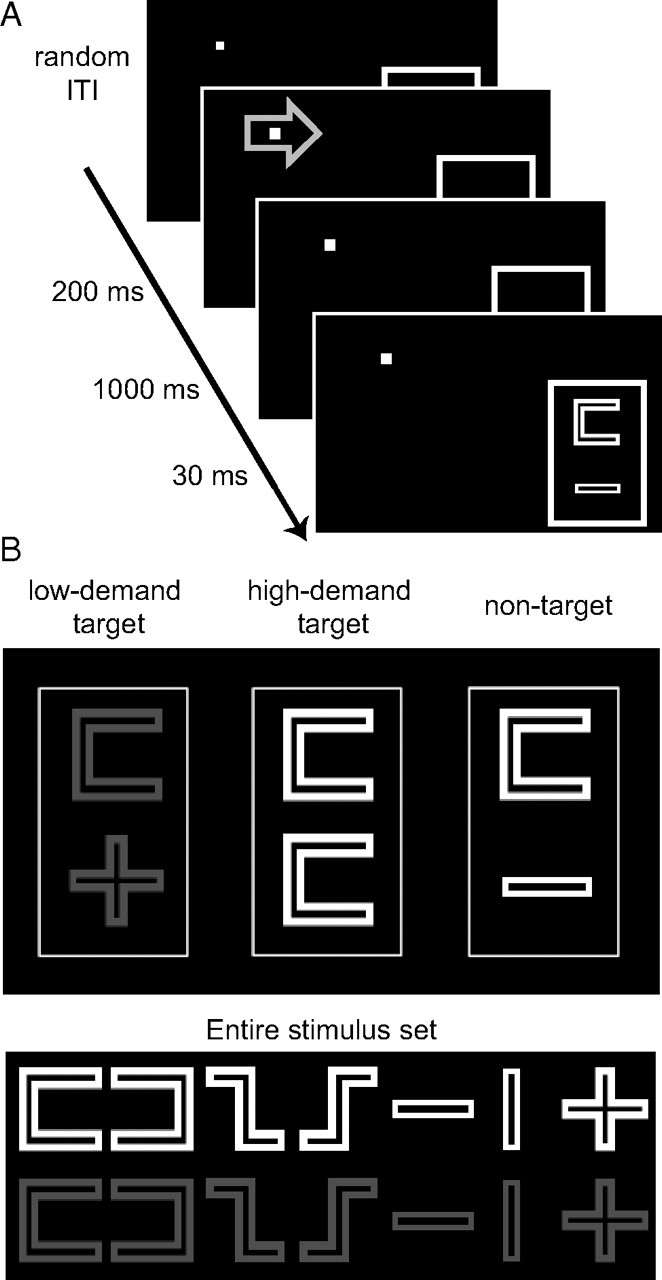
Paradigm and stimuli. A, Cues indicating which discrimination (high or low task demands, indicated by blue or green cue color, here represented in light gray) had to be performed were followed 1000 ms later by the brief presentation of two symbols within a peripheral rectangle in the right visual hemifield. B, Stimulus presentations either consisted of two red symbols (targets under the low task-demand condition; here represented in dark gray; left), two identical white symbols (targets under the high task-demand condition; middle), or two nonidentical white symbols (nontargets under both task instructions; right). Therefore, low-demand targets required detecting a color deviant, whereas high-demand targets required comparing the shape of two symbols. The full set of symbols is displayed (bottom; red stimuli again represented in dark gray). Note that fMRI analyses focused exclusively on nontarget trials that were physically identical under the high-demand versus low-demand conditions, thus stimulus differences cannot explain the observed fMRI results.