
Figure 10.
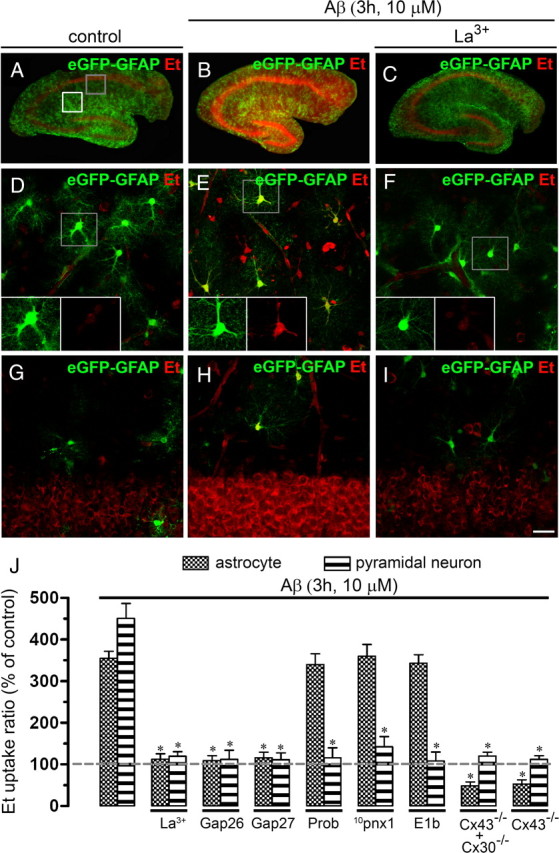
Aβ25–35 increases the Et uptake in astrocytes and neurons of acute hippocampal slices. A–I, Representative images of acute hippocampal brain slices made from eGFP-GFAP transgenic mice showing eGFP-GFAP (green) and Et (red) uptake under control conditions (A), treated for 3 h with 10 μm Aβ25–35 alone (B) or Aβ25–35 plus 200 μm La3+ (C). D–F, Representative images of Et (red) uptake by hippocampal eGFP-GFAP astrocytes (green) under control conditions (D), treated for 3 h with 10 μm Aβ25–35 alone (E), or Aβ25–35 plus 200 μm La3+ (F) applied during the dye uptake measurements. Images of hippocampal astrocytes were taken from the zone depicted by the white square in A. The respective bottom insets of representative astrocytes with staining for Et and eGFP-GFAP are also shown in D–F. G–I, Representative images of Et (red) uptake by hippocampal pyramidal neurons under control conditions (G), treated for 3 h with 10 μm Aβ25–35 alone (H), or plus 200 μm La3+ (I). Images of pyramidal neurons were taken from the zone depicted by the gray square in A and then inverted for more clarity. J, Averaged data normalized to control (dashed line) of Et uptake rate of hippocampal astrocytes (gray bars) or pyramidal neurons (striped bars) treated with Aβ25–35 (10 μm; 3 h) or treated with Aβ25–35 plus the following blockers applied during dye uptake recording: La3+ (200 μm), Gap26 (200 μm), Gap27 (200 μm), Prob (500 μm), 10panx1 (200 μm), or E1b (200 μm). Also shown is the Et uptake ratio in hippocampal astrocytes of Cx30−/− Cx43fl/fl: GFAP-cre (Cx30−/−Cx43−/−) and Cx43fl/fl: GFAP-cre (Cx43−/−) mice. *p < 0.005, effect of each blocker compared with the respective effect induced by 10 μm Aβ25–35 for 3 h. Averaged data are obtained from six independent experiments. Scale bar: A–C, 2 mm; D–I, 50 μm. Error bars indicate SEM.