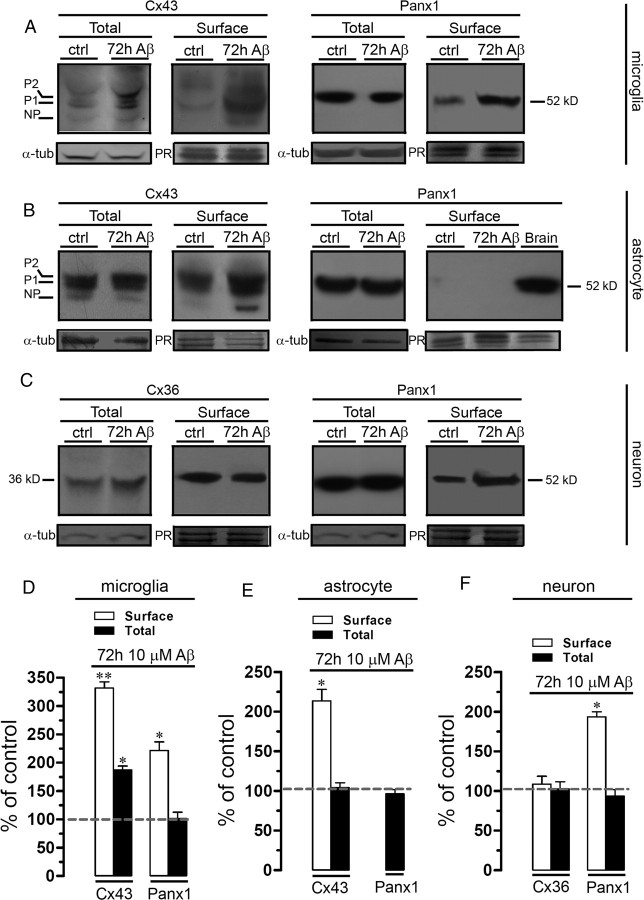
Figure 4.
Aβ25–35 increases the surface levels of Cx43 in microglia and astrocytes and Panx1 in microglia and neurons. Cultured microglia (A), astrocytes (B), or neurons (C) were treated for 72 h with 10 μm Aβ25–35. A, Total and surface levels of Cx43 (left panel) and Panx1 (right panel) in microglia under control conditions (lane 1) or treated for 72 h with 10 μm Aβ25–35 alone (lane 2). B, Total and surface levels of Cx43 (left panel) and Panx1 (right panel) present in astrocytes under control conditions (lane 1) or treated for 72 h with 10 μm Aβ25–35 (lane 2). C, Total and surface levels of Cx36 (left panel) and Panx1 (right panel) present in neurons under control conditions (lane 1) or treated for 72 h with 10 μm Aβ25–35 (lane 2). The Cx43 phosphorylated (P1–P2) and nonphosphorylated (NP) forms are indicated in the left of respective gel. Total levels of each analyzed protein were normalized according to the levels of α-tubulin detected in each lane. Surface levels of each analyzed protein were normalized according to the total protein loaded as reveled by staining with Ponceau red (PR) in each lane. D–F, Quantitation of surface (white bars) and total (black bars) levels of Cx43 and Panx1 in microglia (D) and astrocytes (E) under control conditions or subjected to 72 h treatment with 10 μm Aβ25–35. F, Quantification of surface (white bars) and total (black bars) levels of Cx36 and Panx1 in neurons under control conditions or subjected to 72 h treatment with 10 μm Aβ25–35. Averaged data were obtained from at least three independent experiments. *p < 0.05, **p < 0.005, compared with control. Error bars indicate SEM.

