Figure 1.
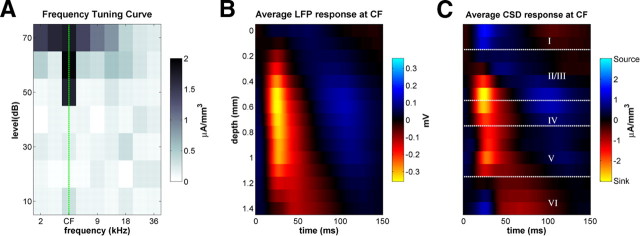
LFP and CSD profiles in rat primary auditory cortex in response to isolated pure-tone stimuli. A, Frequency tuning in an example electrode penetration. The grayscale shows evoked CSD amplitude at 500 μm below the cortical surface and reveals a V-shaped tuning curve with an identifiable CF. B, Trial-averaged LFP depth profile for the same penetration, in response to 70 dB SPL tones at CF. C, Trial-averaged CSD depth profile for the same penetration. The white dotted lines indicate the approximate depths of cortical layers boundaries. Current sinks (net inward transmembrane currents) are shown in red and current sources (net outward currents) in blue.

