Figure 11.
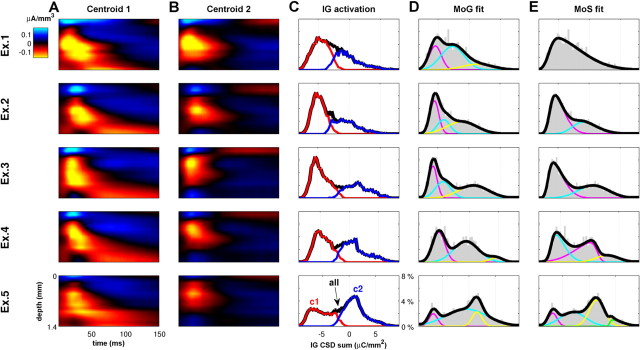
Distribution of infragranular activation during CSD events, for five example electrode penetrations. A, Centroids of the first cluster, with infragranular activation, shown for five electrode penetrations. B, Centroids of the second cluster, without infragranular activation. C, Distribution of the infragranular (IG) CSD sum of the detected events, as in Figure 10F. Black line gives the histogram for all CSD events, colors for each cluster, respectively. D, For each penetration, we used maximum likelihood methods to fit the empirical distribution of infragranular CSD sums (gray bars) with a mixture of Gaussian (MoG) model (colored lines, constituent Gaussians; black line, resulting MoG model). As the empirical distributions ranged from skewed unimodal distributions (e.g., top row) to bimodal and multimodal distributions (bottom 3 rows), so the number of Gaussians required for the best fit ranged between 2 and 6, with a mean of 3.4 across all penetrations. The empirical distributions were always better described by a mixture of Gaussians than by a single Gaussian. E, Because many of the empirical distributions had significant skew, we repeated the method in D by fitting a mixture of skew-normal (MoS) distributions (Azzalini and Valle, 1996). This typically reduced the size of the best mixture model. Although the empirical distributions were best fit by a single skew normal for 5 of 24 penetrations, the majority required a mixture of two or more. The mean number required was 2.6. This strongly suggests at a categorical nature to infragranular activation.

