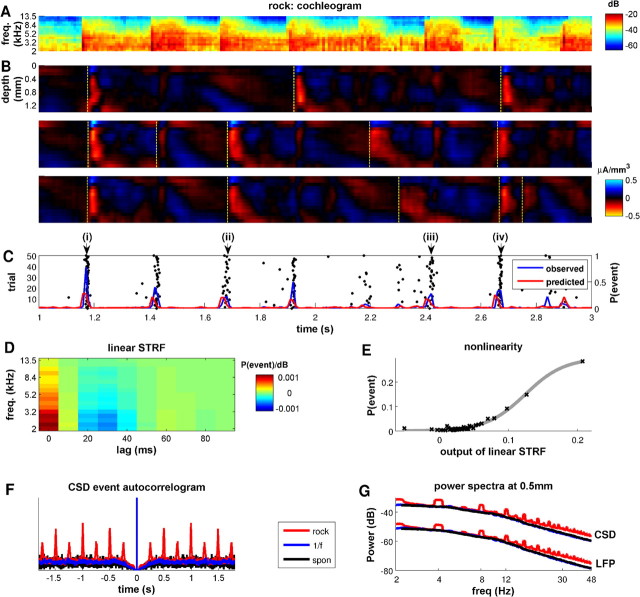
Figure 2.
CSD events entrain to stimulus features. A, Cochleogram (spectrographic) representation of a 2 s segment of the rock music stimulus. B, CSD profiles recorded in one multi-electrode penetration in response to three individual presentations of the stimulus shown in A. The dashed yellow lines show CSD events detected by our algorithm. C, The black dots provide a raster display of CSD events detected during 50 stimulus repetitions. The blue line shows the observed CSD event rate as a function of time after the start of the music stimulus, and the red line shows the event rate predicted from a linear–nonlinear model, comprising the linear STRF of the CSD events shown in D. The prediction of the model captures 47% of the variance in the observed distribution of CSD events for this penetration. D, STRF of the CSD events recorded in response to the rock music stimulus. The observed best frequencies in this STRF (∼2–3 kHz) correlate well with those found in this penetration during stimulation with isolated pure tones. E, Static output nonlinearity for the penetration whose STRF is shown in D. The full linear–nonlinear prediction of the model is generated by first convolving the stimulus with the STRF and then passing the output of this (linear) function through a static nonlinear function. Here we fit a sigmoid function as the output nonlinearity. F, Autocorrelogram of CSD event times for the different stimulus conditions, averaged across multi-electrode penetrations. Note the ∼300 ms refractory period in all stimulus conditions. The autocorrelogram obtained with the rock music stimulus features regular peaks every 250 ms, marking an entrainment of the CSD events to the regular beat of the music. G, Power spectra of the LFP and CSD traces recorded at a depth of 0.5 mm, averaged across multi-electrode penetrations.

