Figure 3.
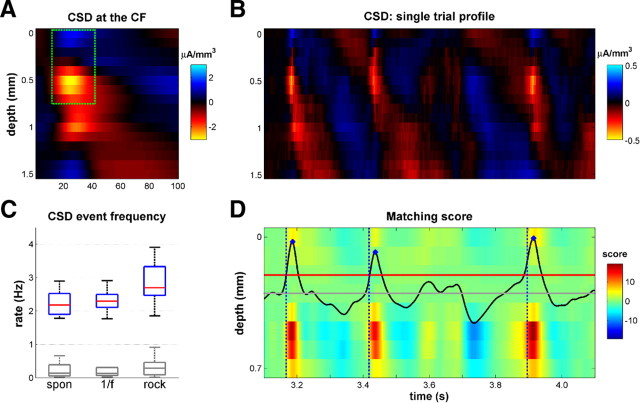
CSD event detection algorithm. A, Average CSD in response to 70 dB pure tones at the CF of this penetration. The green rectangle outlines the part of the CSD used for the event detection algorithm (from 0 to 700 μm and from 12 to 42 ms after tone onset). This dipole is a consistent feature seen throughout our sample of pure-tone-evoked CSDs. B, A single-trial CSD profile. Note the presence of three CSD events that resemble the pattern shown in A. C, Box plots of the CSD event rate for both stimulus conditions (1/f, rock) and in silence (spon). Blue boxes indicate the interquartile range, red lines show the medians, and whiskers denote the full observed range. The gray box plots show estimated rates of false positives, as explained in Materials and Methods. D, Illustration of the CSD detection algorithm. Each row in the color image shows the convolution of the typical CSD pattern (green rectangle in A) with the CSD shown in B at each depth. The total matching score is the sum of these eight convolutions (black line). The three local maxima (blue dots) that are greater than the threshold (red line) identify CSD events. We estimated the onset times of the CSD events as 19 ms before this peak, based on the typical latencies between the first appearance of the current sink and the peak of the convolution. We chose the smallest threshold that keeps the false-alarm rate close to zero.

