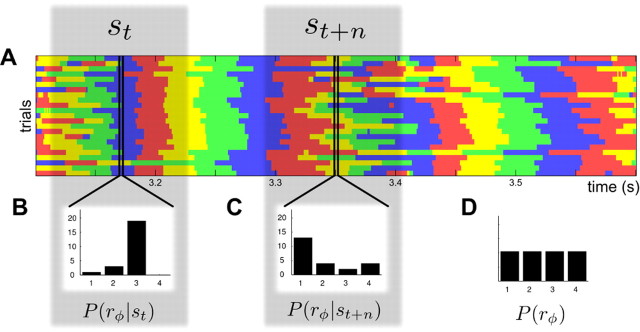
Figure 6.
Illustration of the computation of mutual information between CSD/LFP phase and the stimulus. This figure sketches how we computed the information carried by the CSD/LFP phase about which section of the dynamic stimulus was being presented. We first binned the signal phase into quadrants at each time point during stimulus presentation. A shows an example of these sequences across 25 repeated presentations of 1.2 s of rock music, with phase quadrants color coded as in Figure 4F. We next determined the distribution of phase quadrants across trials, for each time point. These distributions are exemplified in B and C for two example time points. We used Equation 1 in Materials and Methods to calculate the information, using the distribution of phases at each time point, and the distribution of phase across all time points (reported in D). Equation 1 quantifies how dissimilar the phase probabilities at each time are from each other and from the distribution of phases across all time points and trials.

