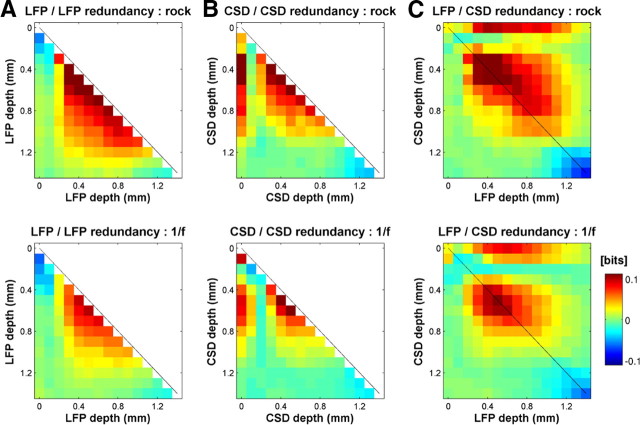
Figure 8.
Information redundancy in LFPs and CSDs. A, Redundancy between the information in the LFP phases at different depths for the rock music stimulus (top) and 1/f stimulus (bottom), for the [7–11] Hz band. Redundancy values are computed through Equation 3 and are expressed in bits. B, Redundancy between the information in the CSD phases at different depths for the [7–11] Hz band. C, Redundancy between the information in the LFP phase and that in the CSD phase recorded at different depths, for the [7–11 Hz] band. As for A and B, for the rock music (top) and 1/f stimuli (bottom) separately.

