Figure 9.
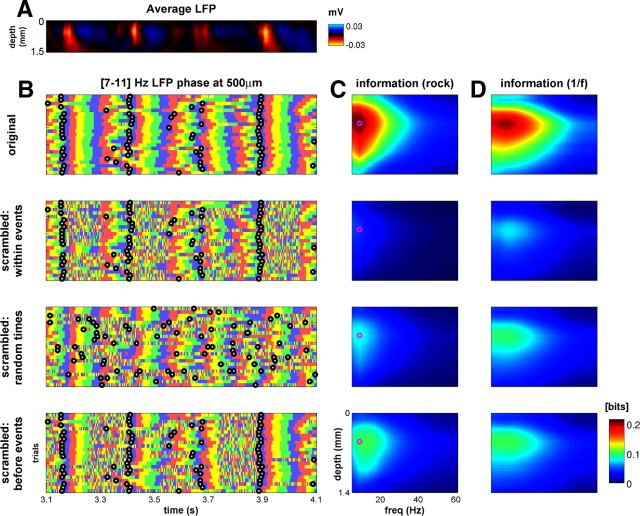
The bulk of LFP phase information coincides with CSD events. A, LFPs recorded in one electrode penetration in response to a 1 s segment of the rock music stimulus and averaged across 25 trials. B, LFP phase in the [7–11] Hz band in the same penetration as that shown in A, at a depth of 500 μm, across 25 trials. Color convention is the same as Figure 4F; the times of CSD events are shown as black circles. In the four rows, LFP phase has either been left unchanged (top row) or scrambled over a window of 150 ms. These windows either began at the same time as CSD events (second row), began at random times (third row), or ended at the same time that CSD events began (bottom row). C, Depth–frequency profiles of stimulus-related information in the LFP phase for the rock music stimulus, plotted as in Figure 7A. The purple circle indicates the [7–11] Hz band at a depth of 500 μm, as illustrated in B. Rows show the effect of scrambling the phase as in B. The most detrimental time to scramble was immediately after CSD event onset: this destroyed 76% of the information for the example band and depth compared with 60% for scrambling at random times and 55% for scrambling immediately before CSD event onset. D, Same as C but for the 1/f stimulus.

