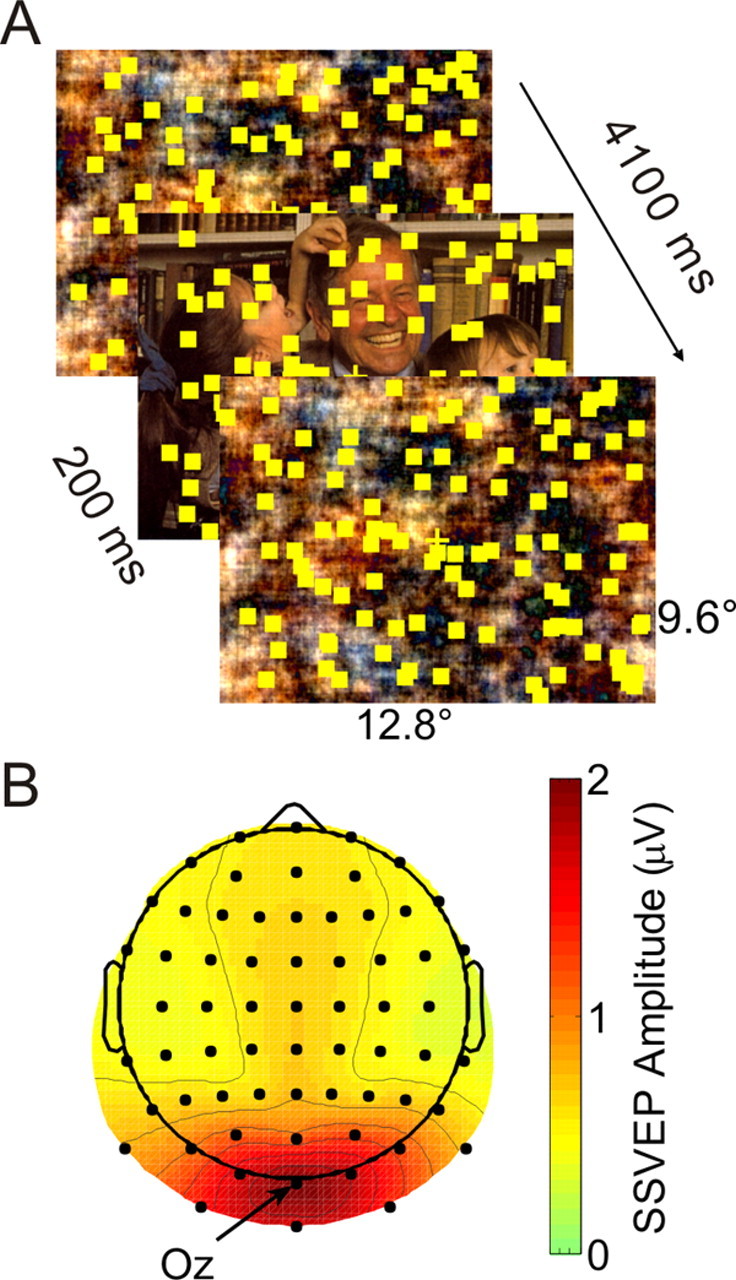
Figure 1.

Schematic stimulus design and SSVEP topography. A, Schematic stimulus design. Each trial lasted for 4100 ms and started with the presentation of a scrambled version of an IAPS picture. After a variable interval, the scrambled picture changed to the concrete version for 200 ms in four steps and back to a new scrambled form again in four steps. Subjects attended to the flickering and moving dots to detect and to respond to intervals of coherent motion of a subset of dots. B, Grand mean spline interpolated voltage map of SSVEP amplitude across all subjects and experimental conditions averaged across the whole analysis epoch. Electrode Oz with greatest SSVEP amplitude is indicated.
