
Figure 1.
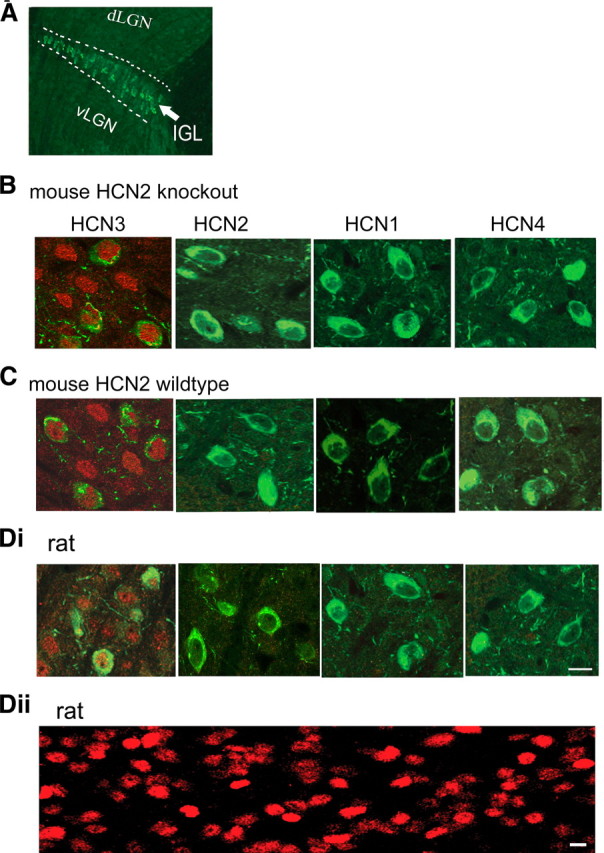
HCN3 is densely expressed in the IGL. A, A representative image of the IGL in a HCN2−/− mouse brain slice (30 μm); the IGL is marked by white dashed lines. NPY staining (green) as a marker for the IGL. B, C, Merged images showing immunolabeling for NPY (green) and HCN (red) in IGL neurons in the mouse (B, C) and the rat (Di, Dii), as indicated. Dii, HCN3-IR in a thick section (200 μm) from the rat. Images in B, C, and Di are from thin sections (30 μm). Note that dense labeling for HCN3 was present on the soma of both NPY-positive and -negative IGL cells in sections from both mice and rats; labeling for other 3 isoforms was essentially absent. Scale bar: 10 μm for all images in B–D.