
Figure 4.
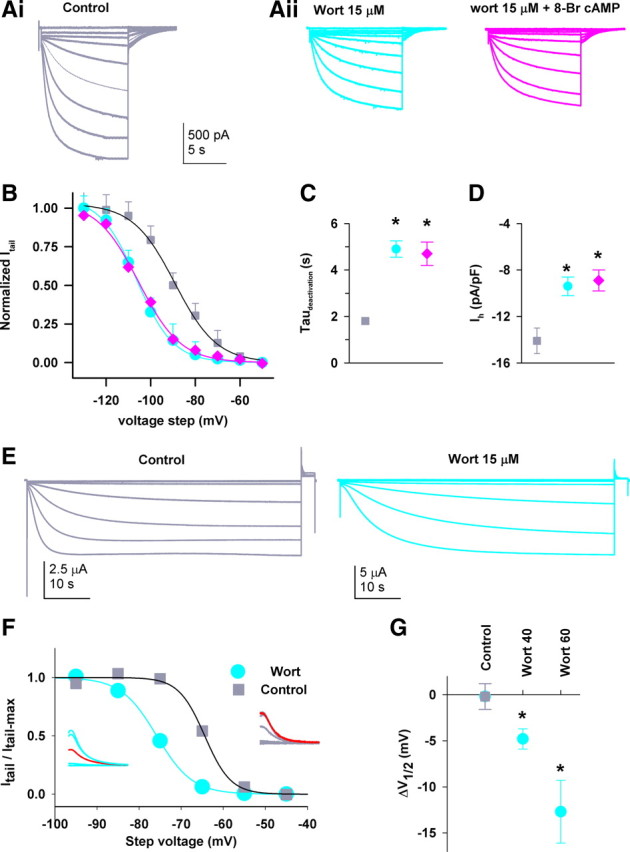
Depletion of endogenous PIP2 produces a hyperpolarizing shift in activation of native and recombinant HCN3 channels. A, Exemplar Ih traces recorded from IGL neurons preincubated for 40–50 min in (Ai, control) or wortmannin (Aii, wort) before or after superfusion with 200 μm 8-Br cAMP. B, Group data showing steady-state activation curves. Lines are fit using a Boltzmann function to normalized tail currents, yielding the V1/2 and slope factor (both in mV) of −89.2 ± 2.4 and 9.4 ± 1.1 for control (squares); −106.3 ± 3.5 and 8.2 ± 1.1 for wortmannin alone (circles); −105.6 ± 2.6 and 9.4 ± 0.9 for wortmannin + 8-Br cAMP (diamonds). Colored symbols used here represent the same conditions in subsequent panels for IGL neurons. There is a significant difference in V1/2 values between control and wortmannin groups, p < 0.001, t test, n = 22. C, D, Effect of the drugs on the activation time constant (at −110 mV (C) and the current density at −130 mV (D). Almost identical effects are observed in IGL neurons from rats (n = 8) and HCN2−/− mice (n = 10), and the two datasets were pooled. *p < 0.05, compared to control. E, HCN3 current traces recorded from intact oocytes following incubation in either control solution (which contains DMSO) (left) or wortmannin (right). F, Effects of wortmannin on steady-state activation curves; inset shows representative tail currents (left, wortmannin and right, control); red traces at −75 mV are for comparison. G, Negative shift in the V1/2 of HCN3 channel activation following incubation with vehicle DMSO (control, n = 10) or wortmannin for 40 (n = 10) or 60 (n = 4) min. Vehicle controls were indistinguishable from the controls in the absence of DMSO (data not shown) in all experiments. The wortmannin-treated populations were significantly different from vehicle control and each other (*p < 0.05, vs control, one-way ANOVA with a Holm–Sidak post hoc test).