
Figure 2.
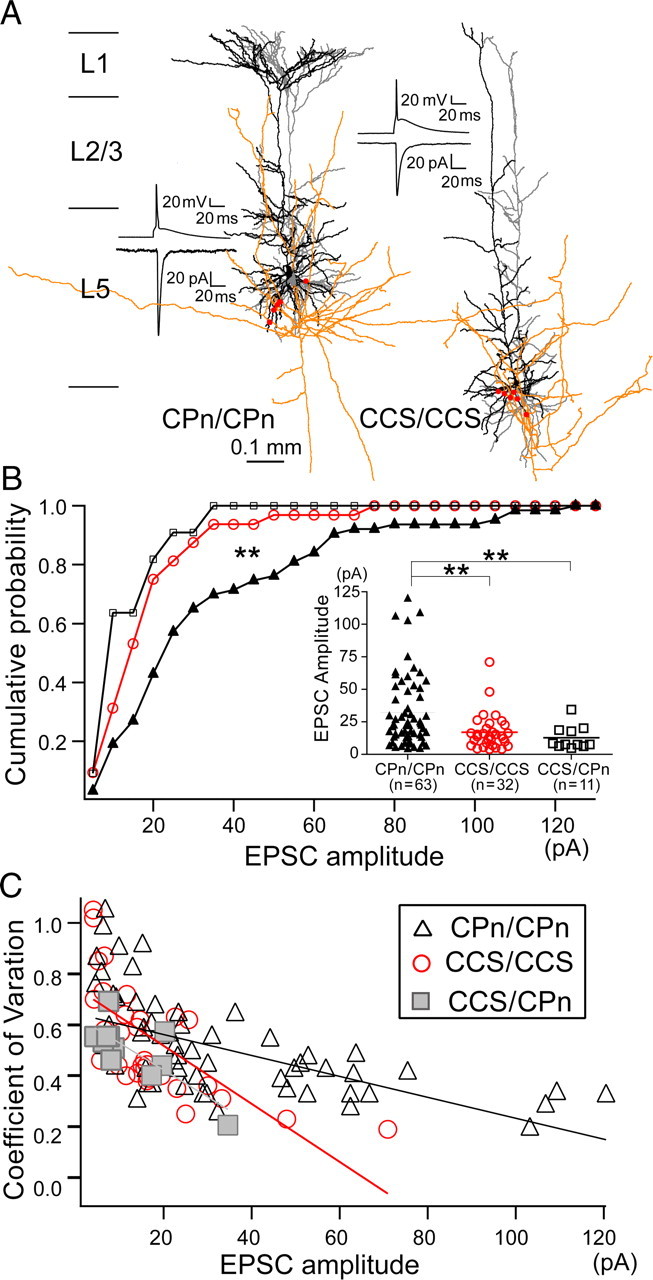
Different EPSC characteristics between CPn/CPn and CCS/CCS connections. A, Synaptic connections of CPn/CPn and CCS/CCS. Insets, Presynaptic action potential and EPSC. Reconstruction of presynaptic dendrites (gray), axons (orange), and postsynaptic dendrites (black). Putative contact sites on postsynaptic dendrites are shown by red circles. B, Cumulative frequency distributions and scatter plots of EPSC amplitudes in three types of connections. Number of connections is shown in parentheses. In cumulative plot, **p < 0.01 (Kolmogorov–Smirnov test); in scatter plots, **p < 0.01 (ANOVA, post hoc Tukey's test). C, Relation between CV of EPSC amplitude with mean EPSC amplitude for three types of connections. Lines indicate linear regression.