
Figure 6.
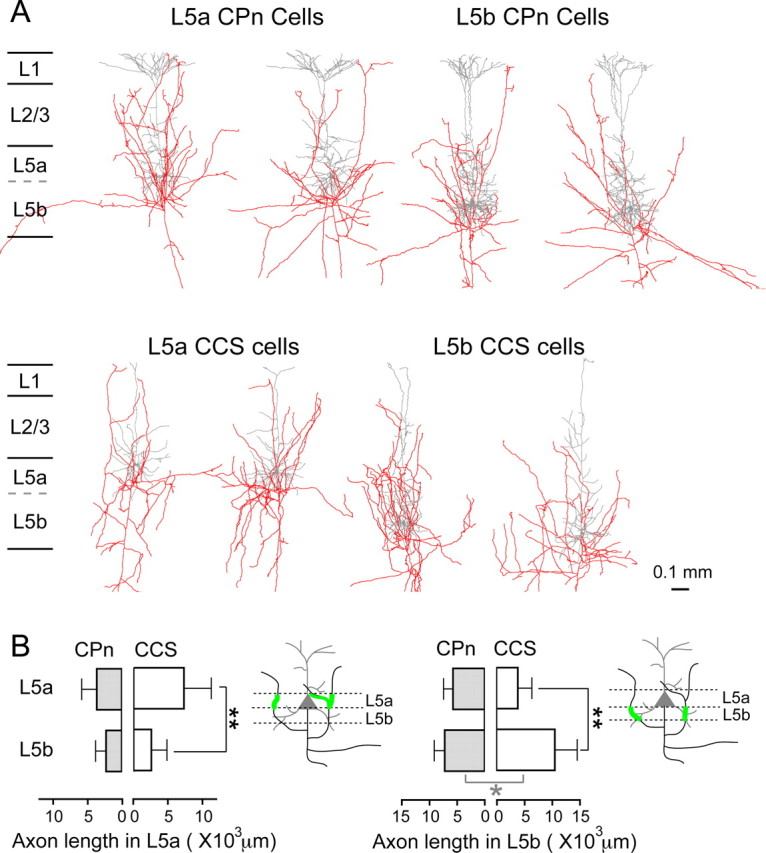
L5 projection subtype- and sublamina-dependent axonal branching patterns. A, Reconstruction of CPn and CCS cell axons (red) and dendrites (gray). B, Comparisons of axon distributions in L5 sublaminae of L5a CPn (n = 8), L5b CPn (n = 10), L5a CCS (n = 6), and L5b CCS cells (n = 13). CCS cells extended their collaterals more locally near their somata than did CPn cells. Error bar, SD; *p < 0.05; **p < 0.01 (gray, comparison between the subtypes of the same sublamina; black, comparison of the same subtype in different sublaminae).