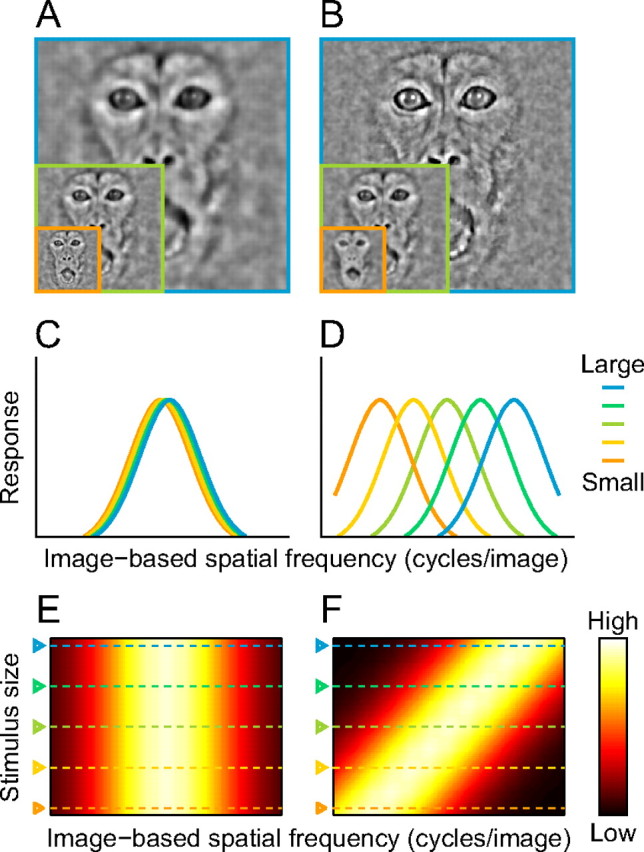
Figure 2.

Tunings for image-based and retina-based SFs. A, B, Optimal stimuli at different sizes for hypothetical neurons tuned to image-based SFs (A) and retina-based SFs (B). These images were created by applying two-dimensional bandpass filters that share the same center image-based SF (A) or same center retina-based SF (B) across different sizes. C, D, Tuning curves for image-based SFs of hypothetical neurons tuned to image-based SFs (C) and to retina-based SFs (D). Curves with different colors correspond to tuning curves at different sizes. E, F, Response fields of neurons tuned to image-based SFs (E) and to retina-based SFs (F). The response magnitude is indicated by a color map.
