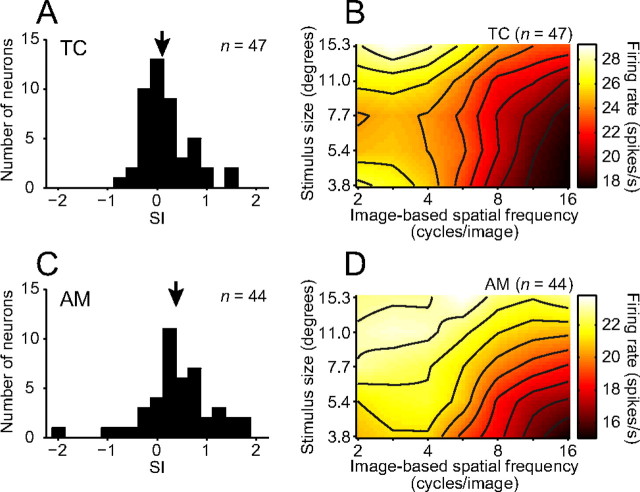
Figure 7.
Comparisons of effects of stimulus size on image-based SF tunings. A, C, Distribution histograms of the SI for face-responsive neurons in the temporal cortex (A; TC) and the amygdala (B; AM). Arrows indicate median values (0.10 for TC and 0.38 for AM). B, D, Averaged response fields across the temporal cortex neurons (B) and amygdala neurons (D). Solid lines represent contour lines.

