
Figure 2.
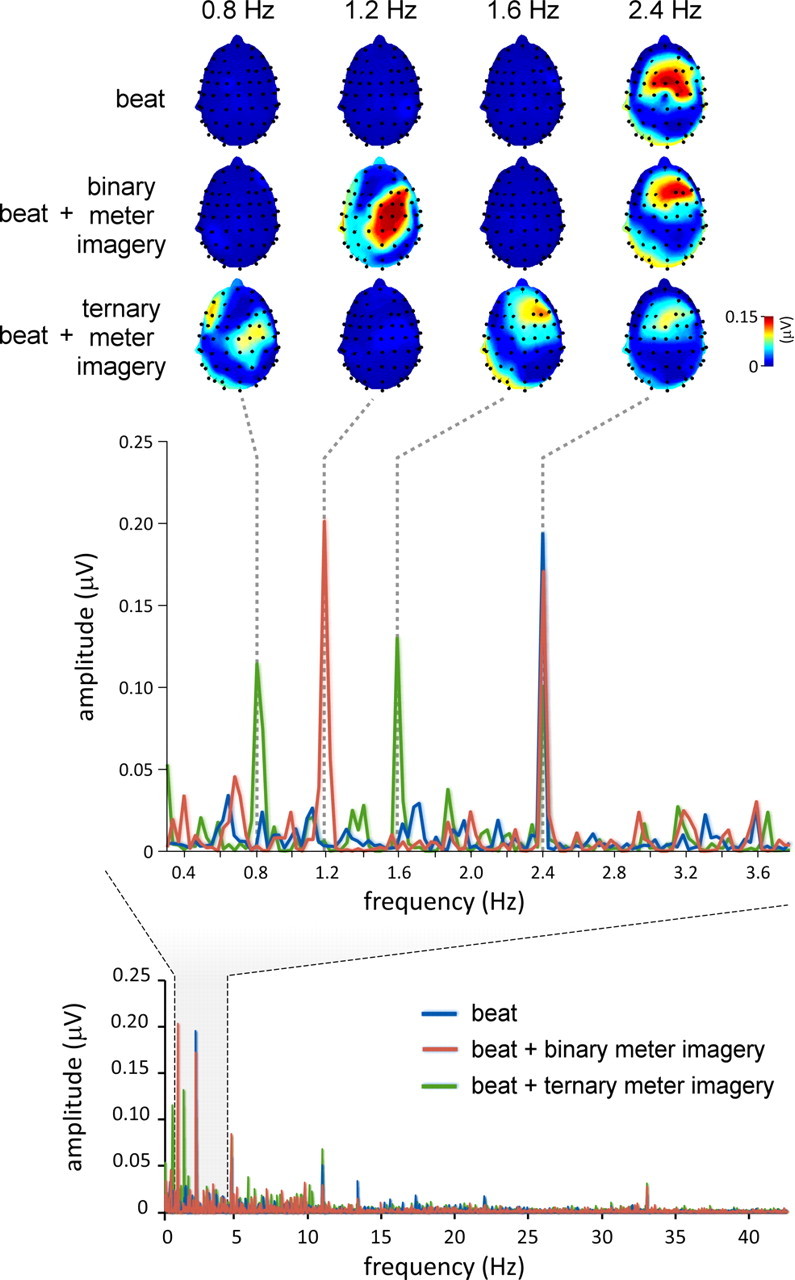
Beat- and meter-related steady-state EPs recorded in a single representative subject. Bottom, The EEG amplitude spectrum (in microvolts) from 0 to 45 Hz, averaged across all scalp electrodes, after applying the noise subtraction procedure (see Materials and Methods). The EEG spectrum obtained in the control condition is shown in blue, whereas the EEG spectra obtained in the binary and ternary meter imagery conditions are shown in red and green, respectively. Middle, The EEG amplitude spectrum (in microvolts) within a frequency range comprising the frequency of the beat (2.4 Hz) and the frequency of the imagined binary and ternary meters (1.2 and 0.8 Hz, respectively). Note that in all three conditions, the auditory stimulus elicited, at f = 2.4 Hz, a clear beat-related steady-state EP. Also note the emergence of a meter-related steady-state EP at 1.2 Hz in the binary meter imagery condition, and at 0.8 and 1.6 Hz in the ternary meter imagery condition. Top, The topographical maps of EEG signal amplitude at 0.8, 1.2, 1.6, and 2.4 Hz, obtained in each of the three conditions.