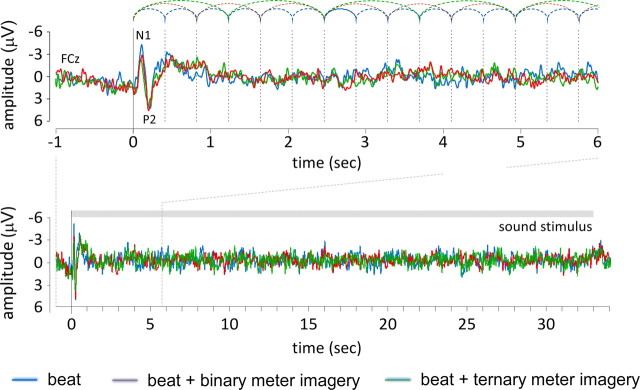
Figure 5.
Transient auditory event-related potentials elicited by the 33 s sound stimulus (group-level average waveforms recorded at FCz) in the control condition (blue), the binary meter condition (red), and the ternary meter condition (green). Top, The onset of the auditory stimulus elicited a clear auditory evoked potential consisting of a negative peak (N1) followed by a positive peak (P2). In contrast, beat onsets (represented by the dashed vertical lines) did not elicit a measurable transient event-related potential.

