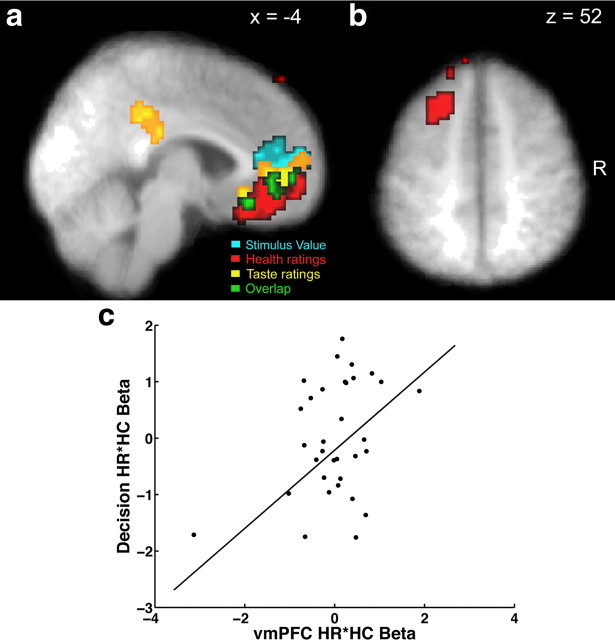
Figure 4.
Activity in vmPFC correlated with both health and taste ratings at the time of decision. Voxels in red are correlated with the parametric regressor for HR, and those in yellow are correlated with the parametric regressor for TR. Voxels in cyan are correlated with the parametric regressor for stimulus value. All three contrasts are thresholded at p < 0.05, corrected. The conjunction of these three contrasts is shown in green. a, Sagittal section showing vmPFC and PCC correlated with HR and TR. b, Axial section showing a region of left dlPFC correlated with HR. c, The scatterplot shows the relationship between the beta coefficient for the interaction of health ratings and health consideration blocks from the behavioral regression for decisions and the same coefficient for vmPFC activity after removing the variance associated with the other vmPFC coefficients in the second fMRI GLM analysis. Each point denotes an individual. The line represents the fit from a robust regression analysis using a bisquare estimator.

