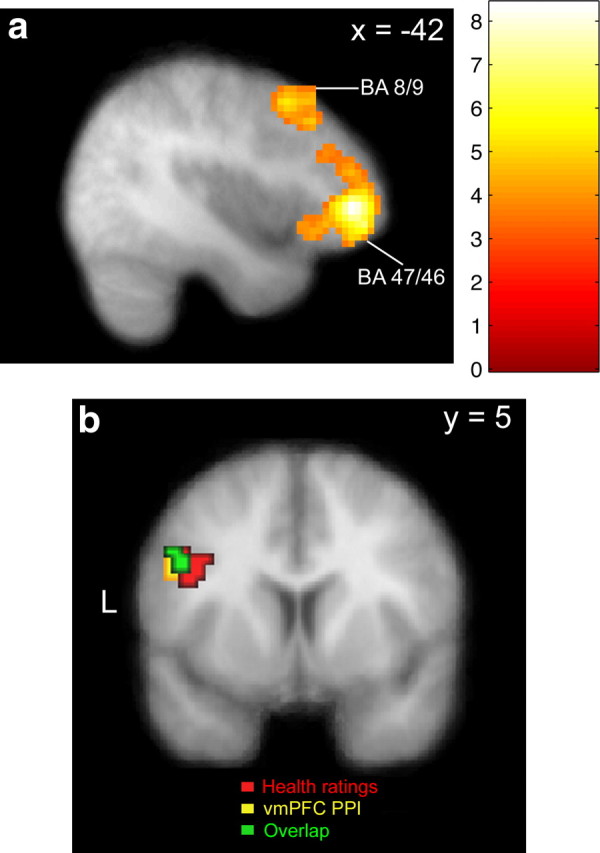
Figure 5.

Potential effectors of the attention-induced changes. a, The statistical parametric map shows regions of lateral prefrontal cortex in BA 8/9 and 46/47 where activity increases during HC blocks (p < 0.05, corrected). b, The conjunction map shows a region of left dlPFC that correlates with HR and had increased coupling with vmPFC at the time of decision. Voxels in red are correlated with the parametric regressor for HR at p < 0.005, uncorrected, and 20 voxel extent. Voxels in yellow show increased coupling with vmPFC (PPI) at the time of decision (p < 0.005, uncorrected; 20 voxel extent). The conjunction of these two contrasts is shown in green.
