Figure 7.
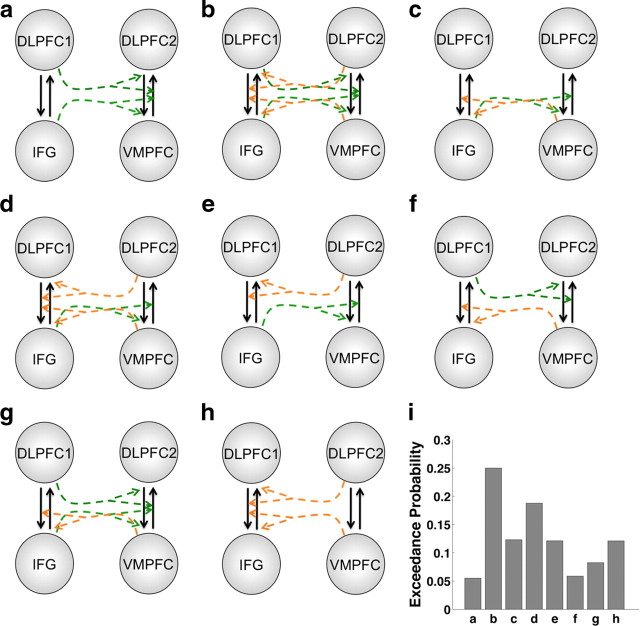
DCM models. a–h, These diagrams show eight alternative models of coupling modulation by different regions. The driving inputs and fixed connections for all models are described in the main text. Dotted arrows represent potential modulation of the coupling between two regions by a third region. Colors are used only to indicate separate modulation pathways. i, Bar graph showing the exceedance probability for each model on the y-axis. The labels on the x-axis correspond to the letters assigned to each diagram.

