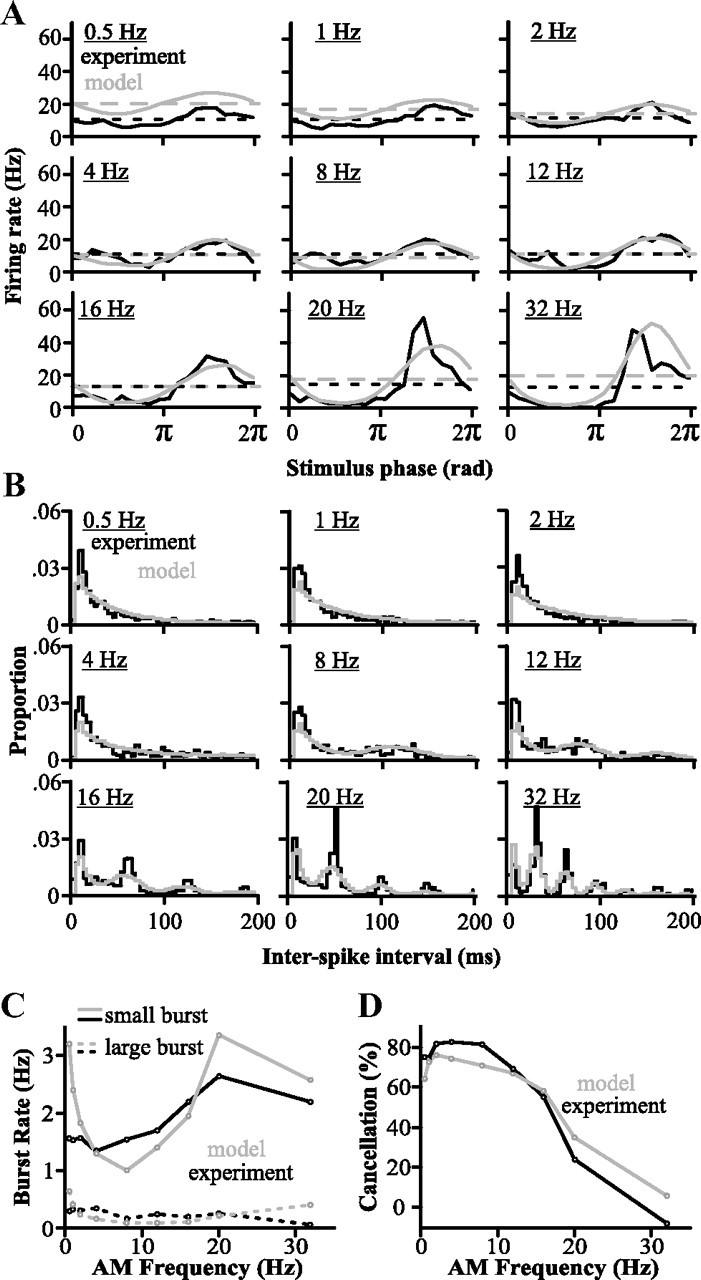
Figure 6.

Comparison of the model with in vivo data showing its ability to replicate the feedback-induced cancellation. This model now includes the frequency dependence of granule cell bursting. A, PSTH of the model and in vivo responses to global stimuli of different frequencies (n = 9 cells). Dashed lines represent average firing rate per second. B, Interspike interval histogram of the model's responses and for experimental data (n = 9 cells). Bin width is 4 ms. C, Burst rates in model and in vivo responses (n = 9 cells). Bursting responses were segregated into small and large bursts as described previously (see also Materials and Methods). D, Cancellation measured for responses of this final version of the model correspond well to the in vivo data (n = 9 cells).
