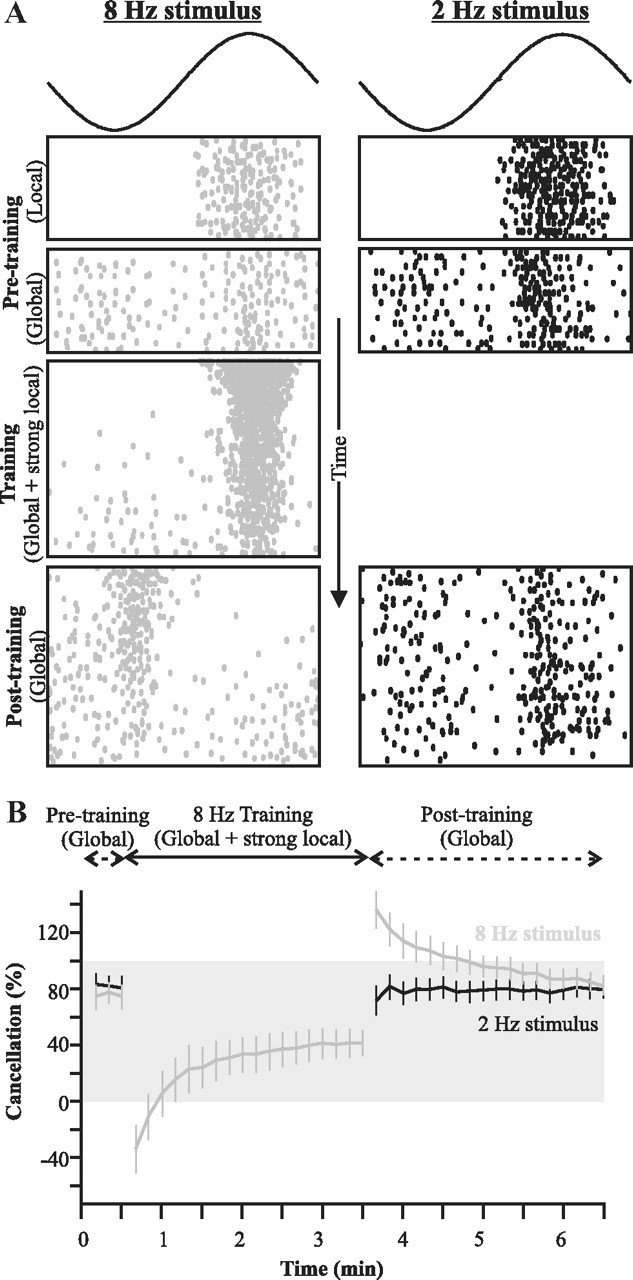
Figure 7.

Frequency-specificity of parallel fiber inputs demonstrated in vivo. A, Raster plot showing, as a function of time, the response of a typical cell to the different steps of the experimental protocol: pretraining baseline for two AM frequencies delivered either locally (no feedback) or globally (thus recruiting feedback); training stimuli of a single frequency where a local stimulus is added to a global one; and posttraining responses to global stimuli revealing the effect of the induced plasticity on the response to the two frequencies. B, Quantification of the mean (±SE; n = 11 cells) canceling impact of the feedback. The gray shading highlights values of cancellation between 0 and 100%. Values below zero mean that the response is more strongly modulated by the stimulus than the uncanceled baseline (local stimulation), and thus that the response is not canceled but enhanced. Values above 100 indicate an overcancellation: cancellation is perfect (100%) when the response is flat across phases. But if the canceling feedback is too strong, the neuron will respond more strongly at the trough of the cycle than at the top (see Materials and Methods for details).
