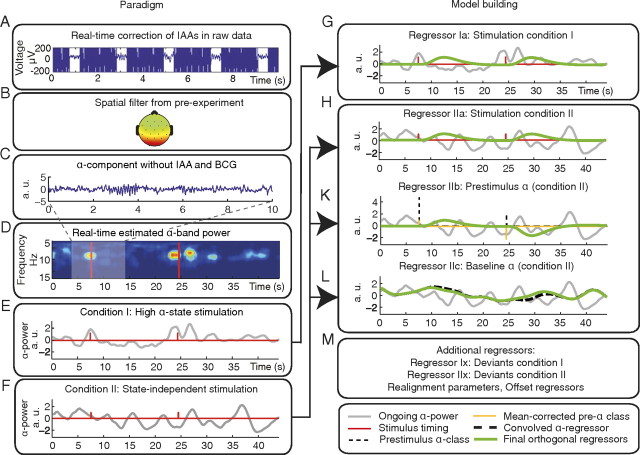
Figure 1.
Scheme of the experimental setup (left) and of the resulting model for analysis (right). A, First, IAAs were removed online. B, Then we used the demixing matrix obtained from the pre-experiment as a spatial filter. C, We extracted the posterior alpha-rhythm component and minimized signatures from other sources, such as heartbeat-related BCG. D, On these data, a short-term FFT was applied to calculate alpha-band power online. E, In the high alpha-state condition, stimulation was triggered when the current alpha-band power exceeded an adaptive threshold (condition I). F, Trigger timings from high alpha-state stimulation condition (condition I) were recorded and used for the state-independent stimulation condition (condition II). G, H, K–M, Model creation for fMRI analysis. Gray, Alpha power; green, final regressors. G, H, Calculation of stimulus regressor for conditions I (Regressor Ia) and II (Regressor IIa). Red, Unconvolved stick functions derived from stimulation. K, Calculation of prestimulus alpha power regressor for condition II (Regressor IIb). Thin dashed line, Parameterized alpha power stick function; orange, after mean correction. Final regressor (green) is orthogonal to Regressor IIa. Regressor IIb is thought to probe the effect of fluctuating prestimulus alpha activity on the evoked fMRI response. L, Calculation of ongoing alpha-power regressor (Regressor IIc). Thick dashed line, Ongoing alpha power convolved with HRF. Final regressor (green) is orthogonalized to Regressors IIa and IIb. Regressor IIc is supposed to probe stimulus-unrelated alpha activity, testing the effect of fluctuating alpha activity on the fMRI baseline. M, The model comprises additional regressors representing deviant stimuli, realignment parameters, and constant offsets.

