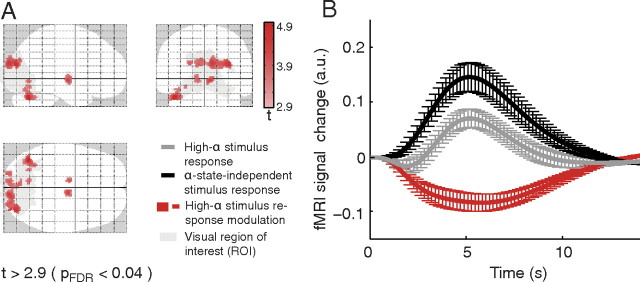
Figure 4.
fMRI results for alpha-dependent stimulus response modulation [t > 2.9; p < 0.04, FDR corrected (pFDR); extent threshold 10 voxels]. A, The observed deactivations (red) within the visual ROI (gray) are projected onto a glass brain template. For corresponding z-values and MNI coordinates with anatomical labeling, see Table 1. B, The resulting response curves for the identified clusters, depicting the high alpha-state stimulus response, the alpha-independent stimulus response, and their difference (error bars indicating SEM across subjects).

