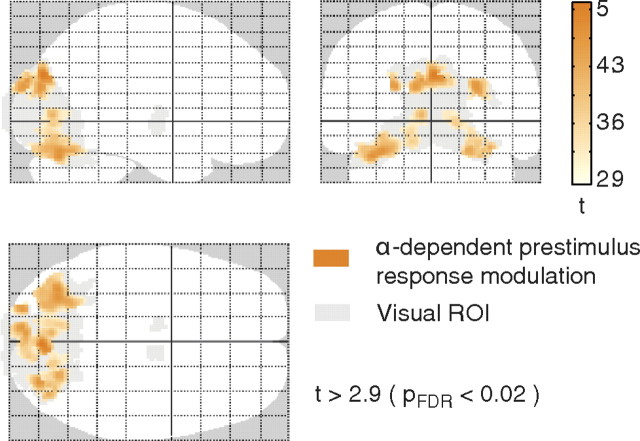
Figure 8.
fMRI results of single-trial prestimulus alpha correlation analysis, testing the effect of fluctuating prestimulus alpha power on the single-trial evoked fMRI response [t > 2.9; p < 0.02, FDR corrected (pFDR); extent threshold 10 voxels]. Found deactivations are depicted on a glass brain (orange; visual ROI, gray). For corresponding z values and MNI coordinates with anatomical labeling, see Table 1.

