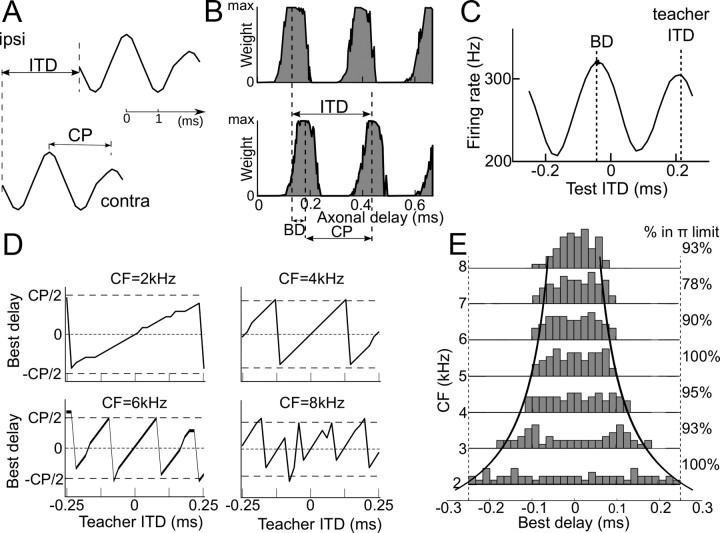
Figure 2.
Development of best delays with fixed ITDs. A, The model is presented with binaurally delayed white noise, bandpass filtered at the CF, with a fixed “teacher” ITD. Here, the ITD is larger than the CP. B, Synaptic weights are modified by activity through STDP (Fig. 1C). At the end of the development period, synaptic weights are periodic with respect to their axonal delay so that contralateral and ipsilateral weights differ by a delay shift that is smaller than the characteristic period. C, As a result, the ITD curve of the neuron, measured with delayed white noise, peaks at the smallest value that has the same phase as the teacher ITD, i.e., within the π-limit. D, Best delay after development versus teacher ITD for CF = 2, 4, 6, and 8 kHz. The BD remains within the π-limit. E, Histograms of BDs for all tested CFs (2–8 kHz), where teacher ITD was varied within the physiological range (−250 to 250 μs). The two curves represent the π-limit.

