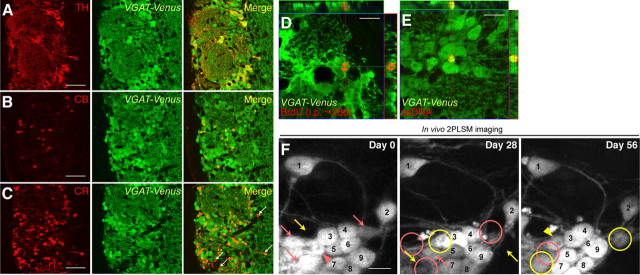
Figure 1.
In vivo three-time-point 2PLSM imaging of PGC turnover in VGAT-Venus mice. A–C, Coronal sections of the olfactory glomerular layer in VGAT-Venus mice stained for PGC subtype-specific markers TH, CB, and CR (red). All the TH+ and CB+ PGCs were labeled with Venus (A and B, respectively, green), whereas a small population of CR+ PGCs was not labeled with Venus (C, white arrows). See also Table 1. D, E, Detection of the addition (D) and apoptosis (E) of Venus+ PGCs using immunohistochemistry. Mice were injected with BrdU to label neuronal progenitors. The analysis was performed 28 d later, when the labeled cells had matured. Representative images of Venus-expressing BrdU+ (D, red) and ssDNA+ apoptotic (E, red) PGCs (D, E, green) are shown. F, In vivo imaging of PGC turnover in VGAT-Venus mice under normal physiological conditions on days 0, 28, and 56. PGCs labeled with a pink arrow had disappeared (pink circles, lost population) at the next imaging session. The PGC labeled with a pink arrowhead observed on day 0 had been lost on day 56 (pink circle). At the positions indicated by a yellow arrow, new added PGCs were observed 28 d later (yellow circles, added population). The PGC labeled with a yellow arrowhead was identified on day 28 and still observed on day 56. PGCs stably observed throughout the experimental period are numbered. Scale bars: A–C, 50 μm; D–F, 10 μm.

